ManualDateTimeScaleOptions.AggregateFunction Property
Gets or sets the function that is used to aggregate date-time axis data when one of the AxisX2D.DateTimeScaleOptions, AxisX3D.DateTimeScaleOptions, or RadarAxisX2D.DateTimeScaleOptions properties is set to ManualDateTimeScaleOptions.
Namespace: DevExpress.Xpf.Charts
Assembly: DevExpress.Xpf.Charts.v23.2.dll
NuGet Package: DevExpress.Wpf.Charts
Declaration
Property Value
| Type | Description |
|---|---|
| AggregateFunction | An AggregateFunction enumeration value. |
Available values:
| Name | Description |
|---|---|
| None | The aggregate function is not applied. |
| Average | Aggregates data by calculating the average value for a selected numeric or date-time interval. |
| Minimum | Aggregates data by calculating the minimum value for a selected numeric or date-time interval. |
| Maximum | Aggregates data by calculating the maximum value for a selected numeric or date-time interval. |
| Sum | Aggregates data by calculating the summary for a selected numeric or date-time interval. |
| Count | Aggregates data by calculating the number of non-null values for a selected numeric or date-time interval. |
| Histogram | Aggregates data by calculating the number of all points for a selected numeric or date-time interval. |
| Financial | Aggregates financial data for a selected interval into a single high-low-open-close data point, so that the high value equals the highest value of all data points in this interval; the low value equals the lowest value of all data points; the open value equals the value of the first data point and the close value equals the value of the last data point. |
| Custom | Aggregates data using the custom CustomAggregateFunction calculator. |
Remarks
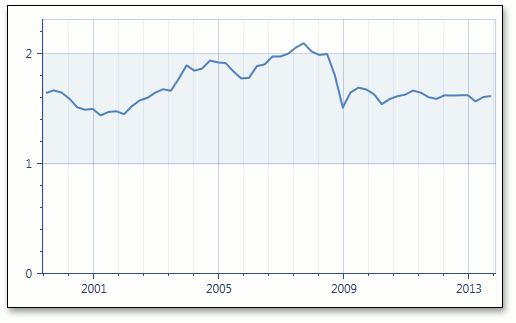
The image below shows date-time data aggregation in the Manual scale mode using the Maximum function.
Note
The AggregateFunction property is set to AggregateFunction.Average by default.
To disable date-time data aggregation, set the AggregateFunction property to AggregateFunction.None.
To learn more, see Data Aggregation.
Example
This example demonstrates how to use the manual date-time scale options of the X-axis.
Data aggregation is enabled automatically for the date-time scale on the X-axis in both automatic and manual scale options.
When the AxisX2D.DateTimeScaleOptions property is set to ManualDateTimeScaleOptions, you can define the ManualDateTimeScaleOptions.GridAlignment, ManualDateTimeScaleOptions.MeasureUnit and ManualDateTimeScaleOptions.AggregateFunction properties manually.
To use the automatic date-time scale options, set the AxisX2D.DateTimeScaleOptions property to AutomaticDateTimeScaleOptions, and select the appropriate AutomaticDateTimeScaleOptions.AggregateFunction.
To prevent the axis scale from being divided into intervals (and thus prevent chart data from being aggregated), set the ManualDateTimeScaleOptions.AggregateFunction property to None.
<Window
        xmlns="http://schemas.microsoft.com/winfx/2006/xaml/presentation"
        xmlns:x="http://schemas.microsoft.com/winfx/2006/xaml"
        xmlns:dxc="http://schemas.devexpress.com/winfx/2008/xaml/charts"
        x:Class="WpfApplication19.MainWindow"
        Title="MainWindow" Height="400" Width="525">
    <Grid>
        <dxc:ChartControl>
            <dxc:XYDiagram2D >
                <dxc:XYDiagram2D.AxisX>
                    <dxc:AxisX2D GridLinesMinorVisible="True" GridLinesVisible="True">
                        <dxc:AxisX2D.DateTimeScaleOptions>
                            <dxc:ManualDateTimeScaleOptions AggregateFunction="Maximum" AutoGrid="False"
                                                            GridAlignment="Year" MeasureUnit="Month"
                                                            GridSpacing="3" GridOffset="1"/>
                        </dxc:AxisX2D.DateTimeScaleOptions>
                    </dxc:AxisX2D>
                </dxc:XYDiagram2D.AxisX>
                <dxc:LineSeries2D DataSource="{Binding Path=Rate}"
                                  ArgumentDataMember="Argument" ValueDataMember="Value"  />
            </dxc:XYDiagram2D>
        </dxc:ChartControl>
    </Grid>
</Window>