HeatmapRangeColorProvider Class
Paints heatmap cells according to value ranges.
Namespace: DevExpress.Xpf.Charts.Heatmap
Assembly: DevExpress.Xpf.Charts.v21.2.dll
NuGet Package: DevExpress.Wpf.Charts
Declaration
Remarks
HeatmapRangeColorProvider paints heatmap cells based on value ranges to which cell values belong. Depending on the data adapter, the HeatmapRangeColorProvider uses HeatmapMatrixAdapter.Values or HeatmapDataSourceAdapter.ColorDataMember values to determine cell colors.
Use the HeatmapControl.ColorProvider property to assign a HeatmapRangeColorProvider object to the heatmap.
The RangeStops property allows you to specify color ranges. To do this, populate the RangeStops collection with HeatmapRangeStop objects. Specify the Value property for each range stop to define a color boundary. Set a range stop’s Type property to Percentage to define color ranges as percentages (in the [0..1] range). This can be helpful if the range of possible values is unknown.
If you want to have smooth transition between colors, enable the ApproximateColors property:
| ApproximateColors = true | ApproximateColors = false |
|---|---|
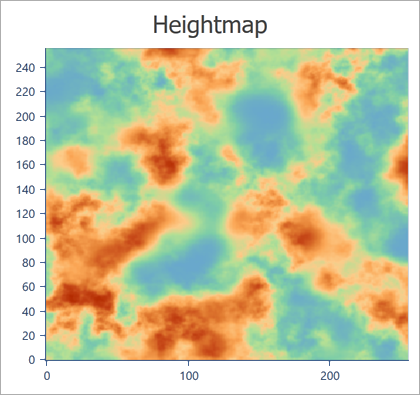 |
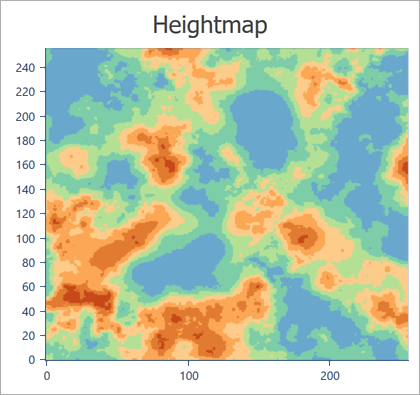 |
Use the color provider’s LegendItemPattern property to format legend items.
To define the color palette applied to cells, use the provider’s Palette property.
Example
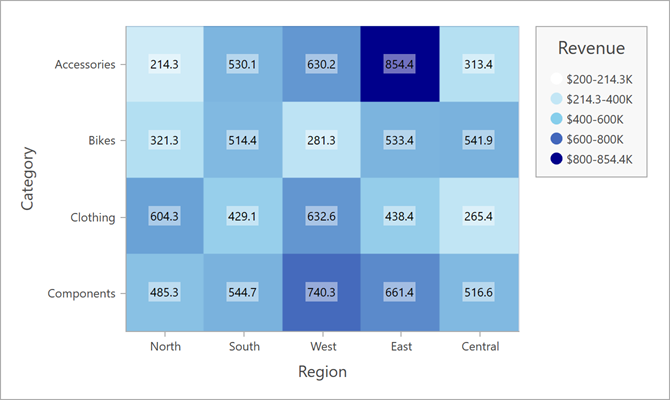
This example shows how to use arrays of string and numeric values to create a heatmap.
Follow the steps below to create a heatmap:
Add the HeatmapControl to the project.
Create a HeatmapMatrixAdapter object and assign it to the HeatmapControl.DataAdapter property.
Use the adapter’s XArguments and YArguments properties to populate the heatmap with x- and y-arguments that are displayed along x- and y-axes.
Assign a two-dimensional array of double values to the adapter’s Values property.
Create a
HeatmapRangeColorProviderobject and assign it to the HeatmapControl.ColorProvider property. The Range Color Provider paints cells based on a value range to which the cell value belongs.Set the HeatmapControl.Legend property to a HeatmapLegend object to display a legend.
Specify the color provider’s HeatmapPaletteColorProvider.LegendItemPattern property to format legend items.
Use the HeatmapControl.AxisX and HeatmapControl.AxisY properties to customize heatmap axes.
To display cell labels, initialize the HeatmapControl.Label property with a HeatmapLabel object.
<dx:ThemedWindow
    xmlns="http://schemas.microsoft.com/winfx/2006/xaml/presentation"
    xmlns:x="http://schemas.microsoft.com/winfx/2006/xaml"
    xmlns:dx="http://schemas.devexpress.com/winfx/2008/xaml/core"
    xmlns:dxh="http://schemas.devexpress.com/winfx/2008/xaml/heatmap"
    xmlns:dxc="http://schemas.devexpress.com/winfx/2008/xaml/charts"
    xmlns:local="clr-namespace:HeatmapMatrixData"
    x:Class="HeatmapMatrixData.MainWindow"
    Title="MainWindow" Height="500" Width="800">
    <Grid>
        <dxh:HeatmapControl>
            <dxh:HeatmapControl.DataContext>
                <local:MatrixHeatmapViewModel/>
            </dxh:HeatmapControl.DataContext>
            <dxh:HeatmapControl.DataAdapter>
                <dxh:HeatmapMatrixAdapter XArguments="{Binding XArguments}"
                                          YArguments="{Binding YArguments}"
                                          Values="{Binding Values}"/>
            </dxh:HeatmapControl.DataAdapter>
            <dxh:HeatmapControl.ColorProvider>
                <dxh:HeatmapRangeColorProvider ApproximateColors="True"
                                               LegendItemPattern="${V1}-{V2}K">
                    <dxh:HeatmapRangeColorProvider.Palette>
                        <dxc:CustomPalette>
                            <dxc:CustomPalette.Colors>
                                <Color>White</Color>
                                <Color>SkyBlue</Color>
                                <Color>DarkBlue</Color>
                            </dxc:CustomPalette.Colors>
                        </dxc:CustomPalette>
                    </dxh:HeatmapRangeColorProvider.Palette>
                    <dxh:HeatmapRangeColorProvider.RangeStops>
                        <dxh:HeatmapRangeStop Value="0" Type="Percentage"/>
                        <dxh:HeatmapRangeStop Value="200"/>
                        <dxh:HeatmapRangeStop Value="400"/>
                        <dxh:HeatmapRangeStop Value="600"/>
                        <dxh:HeatmapRangeStop Value="800"/>
                        <dxh:HeatmapRangeStop Value="1" Type="Percentage"/>
                    </dxh:HeatmapRangeColorProvider.RangeStops>
                </dxh:HeatmapRangeColorProvider>
            </dxh:HeatmapControl.ColorProvider>
            <dxh:HeatmapControl.Legend>
                <dxh:HeatmapLegend Margin="0, 0, 4, 10">
                    <dxh:HeatmapLegend.Title>
                        <dxc:LegendTitle Content="Revenue"/>
                    </dxh:HeatmapLegend.Title>
                </dxh:HeatmapLegend>
            </dxh:HeatmapControl.Legend>
            <dxh:HeatmapControl.AxisX>
                <dxh:HeatmapAxis>
                    <dxh:HeatmapAxis.Title>
                        <dxc:AxisTitle Content="Region"/>
                    </dxh:HeatmapAxis.Title>
                </dxh:HeatmapAxis>
            </dxh:HeatmapControl.AxisX>
            <dxh:HeatmapControl.AxisY>
                <dxh:HeatmapAxis Reverse="True">
                    <dxh:HeatmapAxis.Title>
                        <dxc:AxisTitle Content="Category"/>
                    </dxh:HeatmapAxis.Title>
                </dxh:HeatmapAxis>
            </dxh:HeatmapControl.AxisY>
            <dxh:HeatmapControl.Label>
                <dxh:HeatmapLabel Foreground="Black"
                                  Background="#70ffffff"
                                  Padding="2"/>
            </dxh:HeatmapControl.Label>
        </dxh:HeatmapControl>
    </Grid>
</dx:ThemedWindow>
using DevExpress.Xpf.Core;

namespace HeatmapMatrixData {
    public partial class MainWindow : ThemedWindow {
        public MainWindow() {
            InitializeComponent();
        }
    }
    public class MatrixHeatmapViewModel {
        public string[] XArguments { get; set; }
        public string[] YArguments { get; set; }
        public double[,] Values { get; set; }
        public MatrixHeatmapViewModel() {
            XArguments = new string[] { "North", "South", "West", "East", "Central" };
            YArguments = new string[] { "Accessories", "Bikes", "Clothing", "Components" };
            Values = new double[,] {
               { 214.3, 530.1, 630.2, 854.4, 313.4 },
               { 321.3, 514.4, 281.3, 533.4, 541.9 },
               { 604.3, 429.1, 632.6, 438.4, 265.4 },
               { 485.3, 544.7, 740.3, 661.4, 516.6 }
            };
        }
    }
}