HeatmapControl Class
Displays a customizable and interactive heatmap chart.
Namespace: DevExpress.Xpf.Charts.Heatmap
Assembly: DevExpress.Xpf.Charts.v21.2.dll
NuGet Package: DevExpress.Wpf.Charts
Declaration
public class HeatmapControl :
    Control,
    IContainerElement,
    IChartElement,
    IOwnedElement,
    INotificationOwner,
    IWeakEventListener,
    IDockTarget,
    ISupportNavigationControl,
    IAutoLayoutSupport,
    IContainerLegendOptions,
    IPrintableControl,
IChartsPrintableControlRemarks
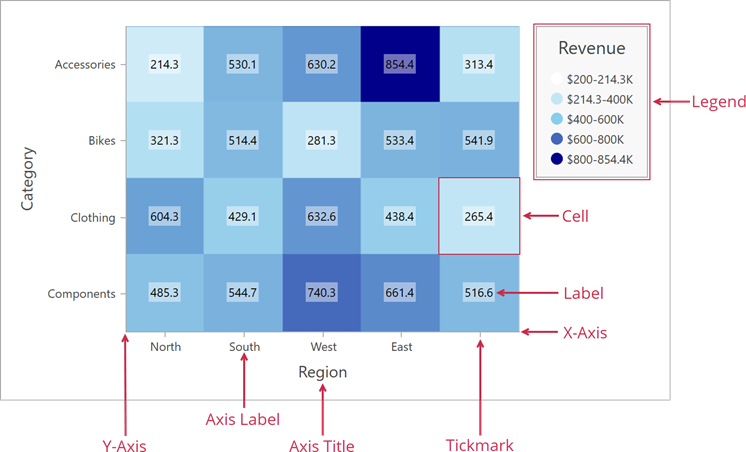
A heatmap is a data analysis tool that uses colors and color intensity to visualize changes in magnitude. Each heatmap cell is defined by three values: X-argument, Y-argument, and Value (Color Value). The arguments are displayed along corresponding axes. The value is used to determine cell color.
The following image shows the main elements of a heatmap:
Demos
The Heatmap Control ships with a set of demo applications that you can explore in the DevExpress Demo Center:
Add a Heatmap Control to the Project
Drag and drop the HeatmapControl component from the Visual Studio Toolbox onto the Window.
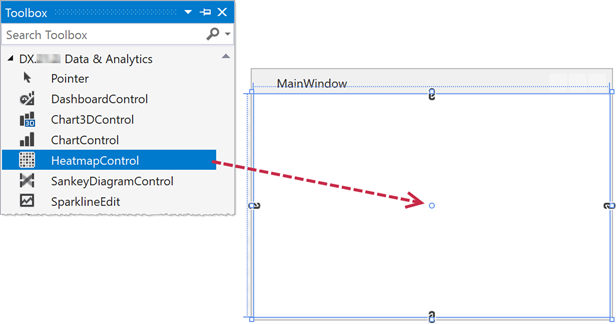
Visual Studio adds the <dxh:HeatmapControl/> tag and corresponding namespace mappings to the MainWindow’s markup:
<Window ...
    xmlns:dxc="http://schemas.devexpress.com/winfx/2008/xaml/charts"
    xmlns:dxh="http://schemas.devexpress.com/winfx/2008/xaml/heatmap"
    ...>
    <Grid>
        <dxh:HeatmapControl/>
    </Grid>
</Window>
Depending on the project type, Visual Studio performs the following actions:
.NET Framework Application
Adds the following assemblies to the project:
- DevExpress.Charts.v21.2.Core.dll
- DevExpress.Data.v21.2.dll
- DevExpress.DataVisualization.v21.2.Core.dll
- DevExpress.Mvvm.v21.2.dll
- DevExpress.Printing.v21.2.Core.dll
- DevExpress.Xpf.Charts.v21.2.dll
- DevExpress.Xpf.Core.v21.2.dll
- DevExpress.Xpf.Printing.v21.2.dll
.NET Core Application
Installs the DevExpress.Wpf.Charts(21.2) NuGet package.
See also: .NET/.NET Core Support
Load Data to a Heatmap
The Heatmap Control uses data adapters to load data. Heatmap data adapters are derived from the HeatmapDataAdapterBase class. Use the Heatmap Control’s DataAdapter property to assign an adapter to a heatmap. The following adapters are available:
- HeatmapDataSourceAdapter
- Allows you to bind the Heatmap Control to a data source.
- HeatmapMatrixAdapter
- Allows you to use collections of values to specify x-arguments and y-arguments, and pass a matrix of numbers to define heatmap cell values.
Paint a Heatmap
The Heatmap Control ships with multiple color providers that implement different coloring algorithms:
- HeatmapKeyColorProvider
- Applies colors to heatmap cells based on color values that are used as key values (keys). Cells with equal keys have the same color.
- HeatmapRangeColorProvider
- Applies colors based on ranges to which cell values belong.
- HeatmapObjectColorProvider
- Applies a color to a cell that is stored in the Color Data Member.
To assign a color provider object to a heatmap, use the HeatmapControl.ColorProvider property.
Configure Cell Labels
Initialize the HeatmapControl.Label property with a HeatmapLabel object to display cell labels.
Specify the HeatmapLabel.TextPattern property to format labels.
Configure Axes
Use the AxisX and AxisY properties to access heatmap axis settings. The Heatmap Control includes the following axis options:
- Alignment – Specifies the title position on the heatmap chart.
- Brush – Specifies the brush used to paint the axis and its tickmarks.
- Label – Allows you to customize axis label settings, such as display format, position, or color.
- CustomLabels – Allows you to replace default axis labels with custom labels.
- GridSpacing – Defines the frequency of axis tickmarks and labels.
- Reverse – Allows you to display axis labels and corresponding rows (columns) in reversed order.
- Thickness – Defines axis thickness.
- TickmarksCrossAxis – Specifies whether tickmarks cross the axis.
- TickmarksLength – Defines tickmark length.
- TickmarksThickness – Specifies tickmark thickness.
- TickmarksVisible – Defines whether tickmarks are visible.
- Title – Specifies axis title options.
- Visible – Specifies whether an axis is visible.
For more information about axis customization, refer to the following topic: HeatmapAxis.
Customize Legend
To display a single legend for a heatmap, initialize the HeatmapControl.Legend property with a HeatmapLegend object.
Legend item content depends on the color provider assigned to the heatmap. For example, the Range Color Provider generates legend items that show value ranges. To format legend item content, use the color provider’s LegendItemPattern property.
Obtain Hit Information about Heatmap Elements
Call the HeatmapControl.CalcHitInfo method to check what heatmap element is located in the test point. This method returns a HeatmapHitInfo object that contains information about the test point and heatmap element.
Zoom and Scroll Heatmap
Enable the HeatmapControl.EnableAxisXNavigation and HeatmapControl.EnableAxisYNavigation properties to allow users to scroll and zoom a heatmap.
Enable and Customize Tooltips
Set the HeatmapControl.ToolTipEnabled property to True to display tooltips when a user hovers over a heatmap cell.
Use the HeatmapControl.ToolTipOptions property to customize tooltip settings, such as the open mode or delay before a tooltip is shown. Specify the HeatmapToolTipOptions.Pattern property to format tooltip text.
Highlight Heatmap Cells
A user can hover over a heatmap cell with the mouse cursor to highlight this cell. Specify the HeatmapControl.HighlightMode property to select an appropriate highlight mode.
Print and Export Heatmap
Use one of the methods below to print the Heatmap control:
- PrintDirect
- ShowPrintPreview
- ShowPrintPreviewDialog
- ShowRibbonPrintPreview
- ShowRibbonPrintPreviewDialog
The following methods allow you to export the Heatmap control to different formats:
- ExportToDocx
- ExportToHtml
- ExportToImage
- ExportToMht
- ExportToPdf
- ExportToRtf
- ExportToXls
- ExportToXlsx
- ExportToXps
The following code exports a heatmap to a PDF file:
<dxh:HeatmapControl x:Name="heatmap">
    <dxh:HeatmapControl.PrintOptions>
        <dxh:HeatmapPrintOptions SizeMode="ProportionalZoom" />
    </dxh:HeatmapControl.PrintOptions>
</dxh:HeatmapControl>
using DevExpress.XtraPrinting;

    private void SimpleButton_Click(object sender, RoutedEventArgs e) {
        PdfExportOptions exportOptions = new PdfExportOptions();
        exportOptions.ConvertImagesToJpeg = false;
        exportOptions.DocumentOptions.Title = "Sales by Categories";
        heatmap.ExportToPdf("D://heatmap-export.pdf", exportOptions);
    }
Examples
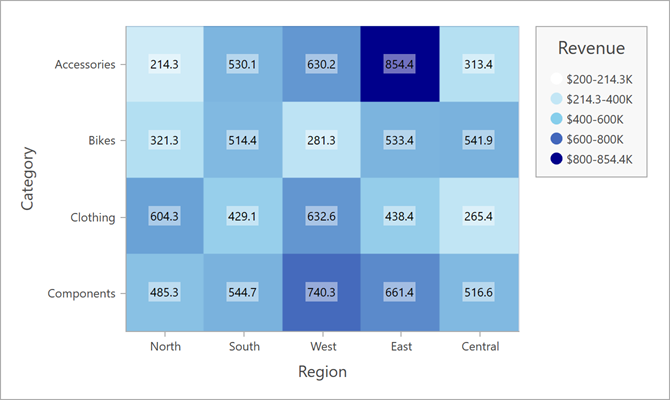
How to Create a Heatmap Based on a Matrix of Numeric Values
This example shows how to use arrays of string and numeric values to create a heatmap.
Follow the steps below to create a heatmap:
Add the
HeatmapControlto the project.Create a HeatmapMatrixAdapter object and assign it to the HeatmapControl.DataAdapter property.
Use the adapter’s XArguments and YArguments properties to populate the heatmap with x- and y-arguments that are displayed along x- and y-axes.
Assign a two-dimensional array of double values to the adapter’s Values property.
Create a HeatmapRangeColorProvider object and assign it to the HeatmapControl.ColorProvider property. The Range Color Provider paints cells based on a value range to which the cell value belongs.
Set the HeatmapControl.Legend property to a HeatmapLegend object to display a legend.
Specify the color provider’s HeatmapPaletteColorProvider.LegendItemPattern property to format legend items.
Use the HeatmapControl.AxisX and HeatmapControl.AxisY properties to customize heatmap axes.
To display cell labels, initialize the HeatmapControl.Label property with a HeatmapLabel object.
<dx:ThemedWindow
    xmlns="http://schemas.microsoft.com/winfx/2006/xaml/presentation"
    xmlns:x="http://schemas.microsoft.com/winfx/2006/xaml"
    xmlns:dx="http://schemas.devexpress.com/winfx/2008/xaml/core"
    xmlns:dxh="http://schemas.devexpress.com/winfx/2008/xaml/heatmap"
    xmlns:dxc="http://schemas.devexpress.com/winfx/2008/xaml/charts"
    xmlns:local="clr-namespace:HeatmapMatrixData"
    x:Class="HeatmapMatrixData.MainWindow"
    Title="MainWindow" Height="500" Width="800">
    <Grid>
        <dxh:HeatmapControl>
            <dxh:HeatmapControl.DataContext>
                <local:MatrixHeatmapViewModel/>
            </dxh:HeatmapControl.DataContext>
            <dxh:HeatmapControl.DataAdapter>
                <dxh:HeatmapMatrixAdapter XArguments="{Binding XArguments}"
                                          YArguments="{Binding YArguments}"
                                          Values="{Binding Values}"/>
            </dxh:HeatmapControl.DataAdapter>
            <dxh:HeatmapControl.ColorProvider>
                <dxh:HeatmapRangeColorProvider ApproximateColors="True"
                                               LegendItemPattern="${V1}-{V2}K">
                    <dxh:HeatmapRangeColorProvider.Palette>
                        <dxc:CustomPalette>
                            <dxc:CustomPalette.Colors>
                                <Color>White</Color>
                                <Color>SkyBlue</Color>
                                <Color>DarkBlue</Color>
                            </dxc:CustomPalette.Colors>
                        </dxc:CustomPalette>
                    </dxh:HeatmapRangeColorProvider.Palette>
                    <dxh:HeatmapRangeColorProvider.RangeStops>
                        <dxh:HeatmapRangeStop Value="0" Type="Percentage"/>
                        <dxh:HeatmapRangeStop Value="200"/>
                        <dxh:HeatmapRangeStop Value="400"/>
                        <dxh:HeatmapRangeStop Value="600"/>
                        <dxh:HeatmapRangeStop Value="800"/>
                        <dxh:HeatmapRangeStop Value="1" Type="Percentage"/>
                    </dxh:HeatmapRangeColorProvider.RangeStops>
                </dxh:HeatmapRangeColorProvider>
            </dxh:HeatmapControl.ColorProvider>
            <dxh:HeatmapControl.Legend>
                <dxh:HeatmapLegend Margin="0, 0, 4, 10">
                    <dxh:HeatmapLegend.Title>
                        <dxc:LegendTitle Content="Revenue"/>
                    </dxh:HeatmapLegend.Title>
                </dxh:HeatmapLegend>
            </dxh:HeatmapControl.Legend>
            <dxh:HeatmapControl.AxisX>
                <dxh:HeatmapAxis>
                    <dxh:HeatmapAxis.Title>
                        <dxc:AxisTitle Content="Region"/>
                    </dxh:HeatmapAxis.Title>
                </dxh:HeatmapAxis>
            </dxh:HeatmapControl.AxisX>
            <dxh:HeatmapControl.AxisY>
                <dxh:HeatmapAxis Reverse="True">
                    <dxh:HeatmapAxis.Title>
                        <dxc:AxisTitle Content="Category"/>
                    </dxh:HeatmapAxis.Title>
                </dxh:HeatmapAxis>
            </dxh:HeatmapControl.AxisY>
            <dxh:HeatmapControl.Label>
                <dxh:HeatmapLabel Foreground="Black"
                                  Background="#70ffffff"
                                  Padding="2"/>
            </dxh:HeatmapControl.Label>
        </dxh:HeatmapControl>
    </Grid>
</dx:ThemedWindow>
using DevExpress.Xpf.Core;

namespace HeatmapMatrixData {
    public partial class MainWindow : ThemedWindow {
        public MainWindow() {
            InitializeComponent();
        }
    }
    public class MatrixHeatmapViewModel {
        public string[] XArguments { get; set; }
        public string[] YArguments { get; set; }
        public double[,] Values { get; set; }
        public MatrixHeatmapViewModel() {
            XArguments = new string[] { "North", "South", "West", "East", "Central" };
            YArguments = new string[] { "Accessories", "Bikes", "Clothing", "Components" };
            Values = new double[,] {
               { 214.3, 530.1, 630.2, 854.4, 313.4 },
               { 321.3, 514.4, 281.3, 533.4, 541.9 },
               { 604.3, 429.1, 632.6, 438.4, 265.4 },
               { 485.3, 544.7, 740.3, 661.4, 516.6 }
            };
        }
    }
}
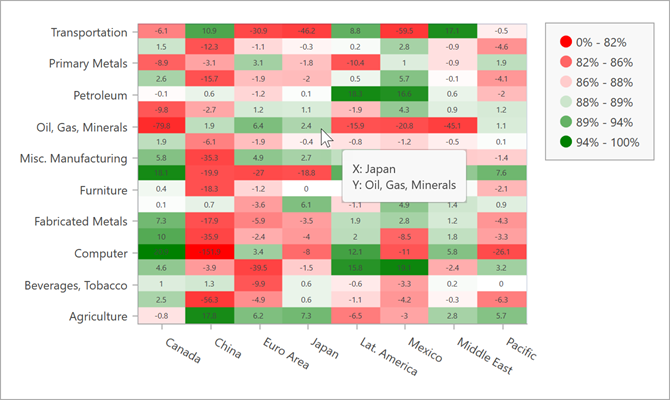
How to Bind a Heatmap to a Data Source (XML File)
The following example shows how to create a heatmap and bind it to a data source. In this example, the heatmap obtains data from an XML file.
Add the
HeatmapControlto the project.Create a HeatmapDataSourceAdapter object and assign it to the HeatmapControl.DataAdapter property.
Define the adapter’s DataSource property.
Use the ColorDataMember property to define a data member that is used to determine cell colors.
Specify the following adapter properties to define data members that store heatmap arguments:
Create a HeatmapRangeColorProvider object and assign it to the HeatmapControl.ColorProvider property. The Range Color Provider paints cells based on a value range to which the cell value belongs.
To display cell labels, initialize the HeatmapControl.Label property with a HeatmapLabel object.
Set the HeatmapControl.Legend property to a HeatmapLegend object to add a legend to the heatmap.
Set the HeatmapControl.ToolTipEnabled property to true to enable tooltips. Specify the HeatmapToolTipOptions.Pattern property to define tooltip text display format.
Use the HeatmapControl.AxisX and HeatmapControl.AxisY properties to customize heatmap axes.
In this example, the x-axis AutoGrid property is disabled and GridSpacing is set to 1 to display all axis labels (without gaps). The Angle property defines axis label rotation to avoid overlapped labels.
<dx:ThemedWindow
xmlns="http://schemas.microsoft.com/winfx/2006/xaml/presentation"
xmlns:x="http://schemas.microsoft.com/winfx/2006/xaml"
xmlns:dx="http://schemas.devexpress.com/winfx/2008/xaml/core"
xmlns:dxh="http://schemas.devexpress.com/winfx/2008/xaml/heatmap"
xmlns:dxc="http://schemas.devexpress.com/winfx/2008/xaml/charts"
x:Class="HeatmapDataSource.MainWindow"
Title="MainWindow" Height="500" Width="800">
<Grid>
<dxh:HeatmapControl ToolTipEnabled="True">
<dxh:HeatmapControl.ToolTipOptions>
<dxh:HeatmapToolTipOptions Pattern="X: {X}
Y: {Y}" />
</dxh:HeatmapControl.ToolTipOptions>
<dxh:HeatmapControl.DataAdapter>
<dxh:HeatmapDataSourceAdapter
DataSource="{Binding}"
XArgumentDataMember="Country"
YArgumentDataMember="Product"
ColorDataMember="Value"/>
</dxh:HeatmapControl.DataAdapter>
<dxh:HeatmapControl.ColorProvider>
<dxh:HeatmapRangeColorProvider ApproximateColors="true"
LegendItemPattern="{}{VP1:0%} - {VP2:0%}">
<dxh:HeatmapRangeColorProvider.Palette>
<dxc:CustomPalette>
<dxc:CustomPalette.Colors>
<Color>Red</Color>
<Color>White</Color>
<Color>Green</Color>
</dxc:CustomPalette.Colors>
</dxc:CustomPalette>
</dxh:HeatmapRangeColorProvider.Palette>
<dxh:HeatmapRangeColorProvider.RangeStops>
<dxh:HeatmapRangeStop Value="0" Type="Percentage"/>
<dxh:HeatmapRangeStop Value="-10"/>
<dxh:HeatmapRangeStop Value="-2.5"/>
<dxh:HeatmapRangeStop Value="0"/>
<dxh:HeatmapRangeStop Value="2.5"/>
<dxh:HeatmapRangeStop Value="10"/>
<dxh:HeatmapRangeStop Value="1" Type="Percentage"/>
</dxh:HeatmapRangeColorProvider.RangeStops>
</dxh:HeatmapRangeColorProvider>
</dxh:HeatmapControl.ColorProvider>
<dxh:HeatmapControl.Label>
<dxh:HeatmapLabel FontSize="8"/>
</dxh:HeatmapControl.Label>
<dxh:HeatmapControl.Legend>
<dxh:HeatmapLegend/>
</dxh:HeatmapControl.Legend>
<dxh:HeatmapControl.AxisX>
<dxh:HeatmapAxis AutoGrid="False"
GridSpacing="1">
<dxh:HeatmapAxis.Label>
<dxc:AxisLabel Angle="30"/>
</dxh:HeatmapAxis.Label>
</dxh:HeatmapAxis>
</dxh:HeatmapControl.AxisX>
<dxh:HeatmapControl.AxisY>
<dxh:HeatmapAxis/>
</dxh:HeatmapControl.AxisY>
</dxh:HeatmapControl>
</Grid>
</dx:ThemedWindow>
using DevExpress.Xpf.Core;
using System;
using System.Data;
using System.IO;
using System.Windows;
using System.Xml;
using System.Xml.Linq;

namespace HeatmapDataSource {

    public partial class MainWindow : ThemedWindow {
        public MainWindow() {
            InitializeComponent();
            DataContext = DataLoader.CreateDataSet("/Data/BalanceOfTrade.xml");
        }
    }
    public static class DataLoader {
        static Stream GetStream(string fileName) {
            Uri uri = new Uri(fileName, UriKind.RelativeOrAbsolute);
            return Application.GetResourceStream(uri).Stream;
        }
        public static XDocument LoadXDocumentFromResources(string fileName) {
            try {
                return XDocument.Load(GetStream(fileName));
            } catch {
                return null;
            }
        }
        public static XmlDocument LoadXmlDocumentFromResources(string fileName) {
            XmlDocument document = new XmlDocument();
            try {
                document.Load(GetStream(fileName));
                return document;
            } catch {
                return null;
            }
        }
        public static DataTable CreateDataSet(string fileName) {
            if (!string.IsNullOrWhiteSpace(fileName)) {
                DataSet dataSet = new DataSet();
                dataSet.ReadXml(GetStream(fileName));
                if (dataSet.Tables.Count > 0)
                    return dataSet.Tables[0];
            }
            return null;
        }
    }
}
The XML file structure looks as follows:
<?xml version="1.0" standalone="yes"?>
<BalanceOfTrade xmlns:xsi="http://www.w3.org/2001/XMLSchema-instance" xmlns:xsd="http://www.w3.org/2001/XMLSchema">
  <xs:schema xmlns:xs="http://www.w3.org/2001/XMLSchema">
    <xs:element name="Item">
      <xs:complexType>
        <xs:sequence>
          <xs:element name="Country" type="xs:string"/>
          <xs:element name="Product" type="xs:string"/>
          <xs:element name="Value" type="xs:double"/>
        </xs:sequence>
      </xs:complexType>
    </xs:element>
  </xs:schema>
  <Item>
    <Country>China</Country>
    <Product>Computer</Product>
    <Value>-151.9</Value>
  </Item>
  <Item>
    <Country>China</Country>
    <Product>Oil, Gas, Minerals</Product>
    <Value>1.9</Value>
  </Item>
  <Item>
    <Country>China</Country>
    <Product>Transportation</Product>
    <Value>10.9</Value>
  </Item>
  <Item>
    <Country>China</Country>
    <Product>Apparel</Product>
    <Value>-56.3</Value>
  </Item>
  <!--...-->
</BalanceOfTrade>