ChartControl Class
The chart control for WPF applications.
Namespace: DevExpress.Xpf.Charts
Assembly: DevExpress.Xpf.Charts.v23.2.dll
NuGet Package: DevExpress.Wpf.Charts
Declaration
public class ChartControl :
    ChartControlBase,
    IContainerElement,
    IChartElement,
    IOwnedElement,
    INotificationOwner,
    IContainerAnimationOptions,
    IEventArgsConverterSource,
    IXtraSupportDeserializeCollection,
    IChartBindingProvider,
    IBindingProvider,
    IVisualChildOwner,
    ISeriesObjectSelector,
    IChartWithData,
    IContainerEventsOptions,
    IContainerToolTipOptions,
    IContainerDataOptions,
    IContainerAnnotationsOptions,
    IContainerChartOptions,
    ISupportNavigationControl,
    ISelectionSupportControl,
IDeserializableElementRelated API Members
The following members return ChartControl objects:
Remarks
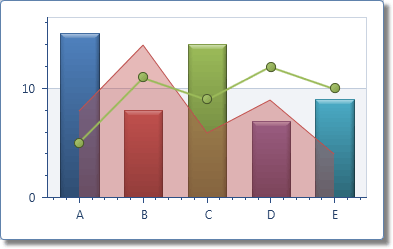
The ChartControl class represents a visual control intended for graphical data representation.
A chart control is comprised of separate elements, such as diagram, series, axes, legend, etc. To learn more about them, refer to Chart Elements.
If separate series have compatible types (that is they evoke the same diagram type), they can be combined in the same diagram (and the chart control, as well). So, because the 2D and 3D series types have different associated diagram types, they cannot be displayed simultaneously. For details on this, refer to Series Type Compatibility.
The ChartControl class can display data from different kinds of data sources, which can be any object implementing either the IEnumerable, IList, IListSource or IBindingList interfaces. Such a data source should be assigned to the Series.DataSource property of a chart’s series. Then, it’s required to specify which data fields should be used as points arguments (Series.ArgumentDataMember) and which - as point values (Series.ValueDataMember).
For more information on this, please refer to the Providing Data section.
Example
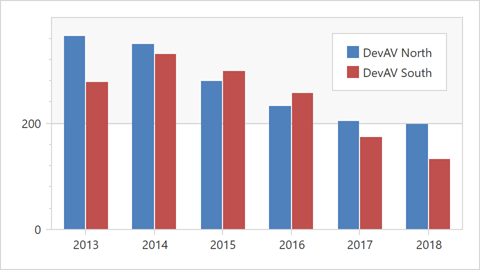
This example shows how to create a 2D Side-by-Side Bar chart.
Create a
ChartControland set its ChartControl.Diagram property to a XYDiagram2D object. Note that the ChartControl.Diagram is a content property. You can declare a diagram in XAML directly after a chart control’s declaration without wrapping it in opening and closing ChartControl.Diagram tags.Specify the Diagram.SeriesItemsSource property to bind a collection of objects used to generate series.
The Diagram.SeriesItemTemplate property allows you to define a template for all series. Use the following API members to configure a series item:
Member Description BarSideBySideSeries2D Represents the 2D Side-by-Side Bar series. Series.DataSource Specifies the series’s data source. Series.ArgumentDataMember Defines the data member that provides the series’s arguments. Series.ValueDataMember Specifies the data member that provides the series’s values. Series.DisplayName Gets or sets the display name of the series. For more information on how to populate a chart with data, see the following section: Providing Data
Use the following API members to configure the x-axis options.
Member Description XYDiagram2D.AxisX Gets the X-axis. AxisX2D Represents the X-axis of a XYDiagram2D class. AxisX2D.DateTimeScaleOptions Provides access to the options that define the behavior of a date-time X-scale when its mode is manual, automatic or continuous. Create a legend and customize its settings. For more information about legends, refer to the following topic: Legends
<Window x:Class="SideBySideBar2DChart.Window1"
        xmlns="http://schemas.microsoft.com/winfx/2006/xaml/presentation"
        xmlns:x="http://schemas.microsoft.com/winfx/2006/xaml"
        xmlns:dxc="http://schemas.devexpress.com/winfx/2008/xaml/charts"
        xmlns:local="clr-namespace:SideBySideBar2DChart"
        Title="Window1" Height="350" Width="620">
    <Window.DataContext>
        <local:ChartViewModel/>
    </Window.DataContext>
    <Grid>
        <dxc:ChartControl Name="chartControl1">
            <dxc:ChartControl.Diagram>
                <dxc:XYDiagram2D SeriesItemsSource="{Binding Data}">
                    <dxc:XYDiagram2D.SeriesItemTemplate>
                        <DataTemplate>
                            <dxc:BarSideBySideSeries2D DisplayName="{Binding Name}"
                                               DataSource="{Binding Values}"
                                               ArgumentDataMember="Argument"
                                               ValueDataMember="Value"
                                               BarWidth="0.6">
                                <dxc:BarSideBySideSeries2D.Model>
                                    <dxc:BorderlessSimpleBar2DModel/>
                                </dxc:BarSideBySideSeries2D.Model>
                            </dxc:BarSideBySideSeries2D>
                        </DataTemplate>
                    </dxc:XYDiagram2D.SeriesItemTemplate>
                    <dxc:XYDiagram2D.AxisX>
                        <dxc:AxisX2D>
                            <dxc:AxisX2D.DateTimeScaleOptions>
                                <dxc:ManualDateTimeScaleOptions MeasureUnit="Year" GridAlignment="Year"
                                                                AutoGrid="False" GridSpacing="1"/>
                            </dxc:AxisX2D.DateTimeScaleOptions>
                        </dxc:AxisX2D>
                    </dxc:XYDiagram2D.AxisX>
                </dxc:XYDiagram2D>
            </dxc:ChartControl.Diagram>
            <dxc:ChartControl.Legends>
                <dxc:Legend HorizontalPosition="Right"/>
            </dxc:ChartControl.Legends>
        </dxc:ChartControl>
    </Grid>
</Window>
using System;
using System.Collections.ObjectModel;
using System.Windows;
namespace SideBySideBar2DChart {
    public partial class Window1 : Window {
        public Window1() {
            InitializeComponent();
        }
    }
    public class ChartViewModel {
        public ObservableCollection<DataSeries> Data { get; private set; }

        public ChartViewModel() {
            Data = new ObservableCollection<DataSeries> {
                new DataSeries{
                    Name = "DevAV North",
                    Values = new ObservableCollection<DataPoint> {
                        new DataPoint (new DateTime(2013,12,31), 362.5),
                        new DataPoint (new DateTime(2014,12,31), 348.4),
                        new DataPoint (new DateTime(2015,12,31), 279.0),
                        new DataPoint (new DateTime(2016,12,31), 230.9),
                        new DataPoint (new DateTime(2017,12,31), 203.5),
                        new DataPoint (new DateTime(2018,12,31), 197.1)
                    }
                },
                new DataSeries{
                    Name = "DevAV South",
                    Values = new ObservableCollection<DataPoint> {
                        new DataPoint (new DateTime(2013,12,31), 277.0),
                        new DataPoint (new DateTime(2014,12,31), 328.5),
                        new DataPoint (new DateTime(2015,12,31), 297.0),
                        new DataPoint (new DateTime(2016,12,31), 255.3),
                        new DataPoint (new DateTime(2017,12,31), 173.5),
                        new DataPoint (new DateTime(2018,12,31), 131.8)
                    }
                }
            };
        }
        public class DataSeries {
            public string Name { get; set; }
            public ObservableCollection<DataPoint> Values { get; set; }
        }
        public class DataPoint {
            public DateTime Argument { get; set; }
            public double Value { get; set; }
            public DataPoint(DateTime argument, double value) {
                Argument = argument;
                Value = value;
            }
        }
    }
}
Related GitHub Examples
The following code snippets (auto-collected from DevExpress Examples) contain references to the ChartControl class.
Note
The algorithm used to collect these code examples remains a work in progress. Accordingly, the links and snippets below may produce inaccurate results. If you encounter an issue with code examples below, please use the feedback form on this page to report the issue.