Annotation.ShapePosition Property
Specifies the annotation position.
Namespace: DevExpress.Xpf.Charts
Assembly: DevExpress.Xpf.Charts.v21.2.dll
NuGet Package: DevExpress.Wpf.Charts
Declaration
Property Value
| Type | Description |
|---|---|
| AnnotationShapePosition | An AnnotationShapePosition class descendant representing the shape position type. |
Remarks
The ShapePosition property can be specified as the RelativePosition or FreePosition type.
The following table uses examples to describe these two annotation shape position types.
The Property Values | The Example Image | Description |
|---|---|---|
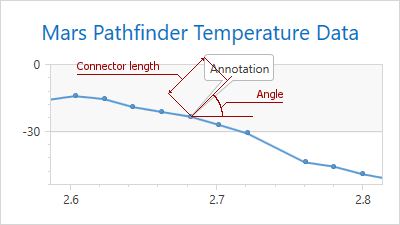
ShapePosition = RelativePosition |
| If the In this example, the ConnectorLength property is set to 70 and the RelativePosition.Angle property is 45. |
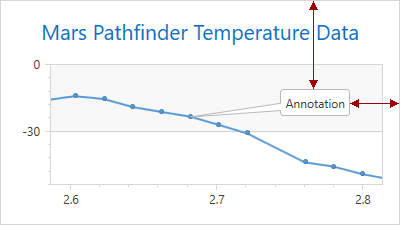
ShapePosition = FreePosition |
| If the In this example, the annotation is docked to a Chart control. The HorizontalAlignment property is set to Right and the VerticalAlignment property is set to Top. The Margin property is defined as (0, 90, 50, 0). |
Examples
Add an Annotation in Markup
This example demonstrates how to anchor an annotation to a series point.
To do this, specify the SeriesPointAnchorPoint.SeriesPoint property.
<dxc:Annotation Content="Annotation #1">
    <dxc:Annotation.AnchorPoint>
        <dxc:SeriesPointAnchorPoint SeriesPoint="{Binding ElementName=seriesPoint}"/>
    </dxc:Annotation.AnchorPoint>
    <dxc:Annotation.ShapePosition>
        <dxc:RelativePosition Angle="60"
                              ConnectorLength="50"/>
    </dxc:Annotation.ShapePosition>
</dxc:Annotation>
Add an Annotation in Code
The following example creates an annotation that is anchored to a pane.
<dxc:ChartControl x:Name="chartControl">
    <dxc:XYDiagram2D x:Name="diagram">
        <dxc:XYDiagram2D.SecondaryAxesX>
            <dxc:SecondaryAxisX2D x:Name="xAxis"/>
        </dxc:XYDiagram2D.SecondaryAxesX>
        <dxc:XYDiagram2D.SecondaryAxesY>
            <dxc:SecondaryAxisY2D x:Name="yAxis"/>
        </dxc:XYDiagram2D.SecondaryAxesY>
        <dxc:XYDiagram2D.Panes>
            <dxc:Pane x:Name="pane"/>
        </dxc:XYDiagram2D.Panes>
        <!--...-->
    </dxc:XYDiagram2D>
</dxc:ChartControl>
using DevExpress.Xpf.Charts;
//...
private void Window_Loaded(object sender, RoutedEventArgs e) {
    Annotation annotation = new Annotation();
    annotation.Content = "Annotation";
    annotation.AnchorPoint = new PaneAnchorPoint {
        AxisXCoordinate = new AxisXCoordinate { AxisValue = new TimeSpan(0, 0, 5), Axis = xAxis },
        AxisYCoordinate = new AxisYCoordinate { AxisValue = 100, Axis = yAxis },
        Pane = pane
    };
    annotation.ShapePosition = new RelativePosition { Angle = 30, ConnectorLength = 60 };
    chartControl.Annotations.Add(annotation);
}
If the chart is bound to data and you want to anchor an annotation to a series point, use the ChartControl.BoundDataChanged event to access the point collection. The following example creates an annotation for each point of a spline series.
<dxc:ChartControl x:Name="chartControl"
                  BoundDataChanged="chartControl_BoundDataChanged">
    <dxc:XYDiagram2D x:Name="diagram">
        <dxc:SplineSeries2D>
            <!--...-->
        </dxc:SplineSeries2D>
    </dxc:XYDiagram2D>
</dxc:ChartControl>
using DevExpress.Xpf.Charts;
//...
private void chartControl_BoundDataChanged(object sender, RoutedEventArgs e) {
    SplineSeries2D series = (SplineSeries2D)diagram.Series[0];
    if (series.Points.Count > 0) {
        for (int i = 0; i < series.Points.Count; i++) {
            chartControl.Annotations.BeginInit();
            Annotation annotation = new Annotation() {
                Content = series.Points[i].Value.ToString()
            };
            annotation.AnchorPoint = new SeriesPointAnchorPoint() {
                SeriesPoint = series.Points[i]
            };
            annotation.ShapePosition = new RelativePosition() {
                Angle = 0,
                ConnectorLength = 0
            };
            chartControl.Annotations.Add(annotation);
            chartControl.Annotations.EndInit();
        }
    }
}