Step Line
Short Description
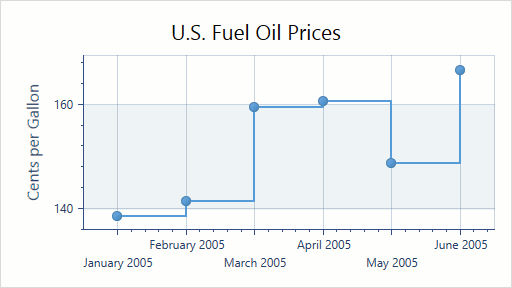
The Step Line series displays data as step lines on a diagram. This chart shows how much values have changed for different points of the same series.
An example of the Step Line chart is shown in the image below.
Series Characteristics
The table below lists the main characteristics of this chart type.
| Feature | Value |
|---|---|
| Series View type | LineStepSeries2D |
| Diagram type | XYDiagram2D |
| Number of arguments per series point | 1 |
| Number of values per series point | 1 |
For information on which series view types can be combined with the Step Line view, refer to the Series Type Compatibility document.
Example
The following example demonstrates how to create a 2D Step Line chart.