Lesson 2 - Create a Linear Gauge
- 6 minutes to read
This is the second tutorial of the DXGauges Getting Started series. It will guide you through the process of creating a Linear gauge and adjusting its common settings.
This tutorial consists of the following steps.
- Create a New Project and Add a Gauge Control
- Add a Scale and a Level Bar
- Add a Secondary Scale
- Add a Marker and Custom Labels
- Specify Ranges
- Result
Step 1. Create a New Project and Add a Gauge Control
In this step we will perform the common actions that are required when you add a Gauge control to your application.
- Run MS Visual Studio 2012, 2013, 2015, 2017 or 2019.
- Create a new WPF Application project.
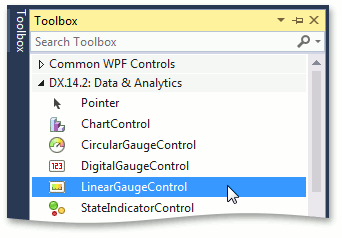
Now add the LinearGaugeControl component to your project. To do this, locate the LinearGaugeControl item in a Visual Studio toolbox on the DX.20.2: Data & Analytics tab and drop it onto the main window.
In this lesson we demonstrate how to create a simple thermometer using LinearGaugeControl.
- To set a style for a conventional thermometer, set the LinearGaugeControl.Model property to LinearRedThermometerModel.
- To adjust a gauge’s layout, set its Margin property to 0, 24, 0, 20.
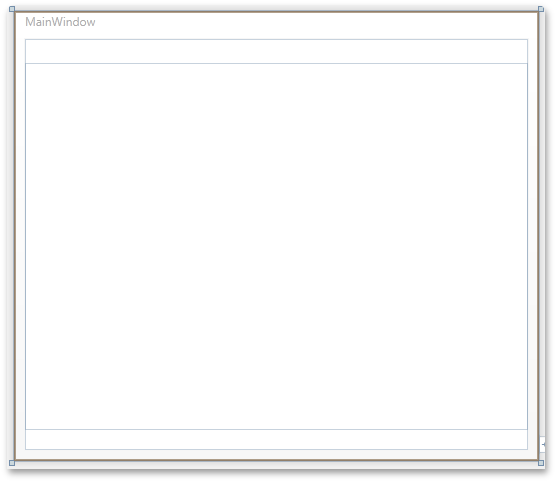
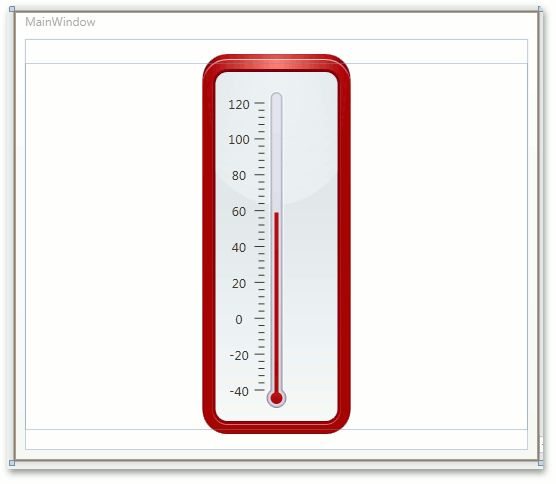
After performing these steps, your MainWindow may look as follows.
Also your XAML should be similar to the following.
<Window x:Class="DXGauges_Linear.MainWindow"
        xmlns="http://schemas.microsoft.com/winfx/2006/xaml/presentation"
        xmlns:x="http://schemas.microsoft.com/winfx/2006/xaml"
        xmlns:dxga="http://schemas.devexpress.com/winfx/2008/xaml/gauges">
        Title="MainWindow" Height="450" Width="525"
    <Grid>
        <dxga:LinearGaugeControl Name="linearGaugeControl1" Margin="0,24,0,20">
            <dxga:LinearGaugeControl.Model>
                <dxga:LinearRedThermometerModel />
            </dxga:LinearGaugeControl.Model>
        </dxga:LinearGaugeControl>
    </Grid>
</Window>
Now we have a Gauge control added to our application and can customize it to meet our requirements.
Step 2. Add a Scale and a Level Bar
Scales are the main elements of a Gauge control because they contain all other elements, and a level bar is critical for a thermometer because it demonstrates the current temperature value.
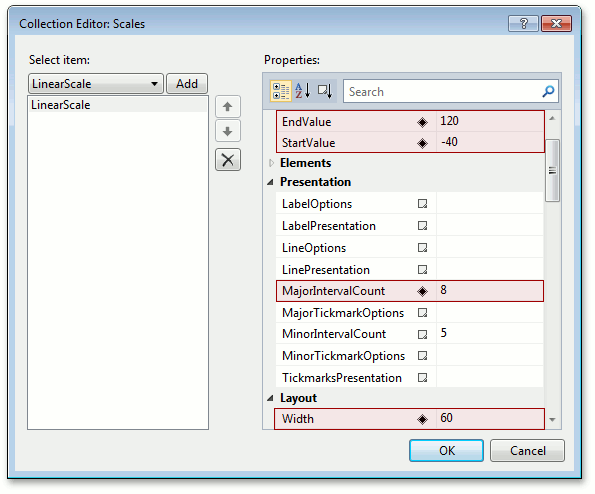
- Let’s add a scale to the gauge. To do this, locate the LinearGaugeControl.Scales property in the Properties window and click the ellipsis button to invoke the Scales collection editor. In this editor, add a new LinearScale object using the Add button.
Specify scale properties as follows.
- Scale.StartValue to -40 and Scale.EndValue to 120 (to set temperature limits similar to Fahrenheit degrees in a real-life thermometer).
- Scale.MajorIntervalCount to 8 (to break the entire interval into 8 equal parts).
- Width to 60 (to provide a conventional thermometer appearance).
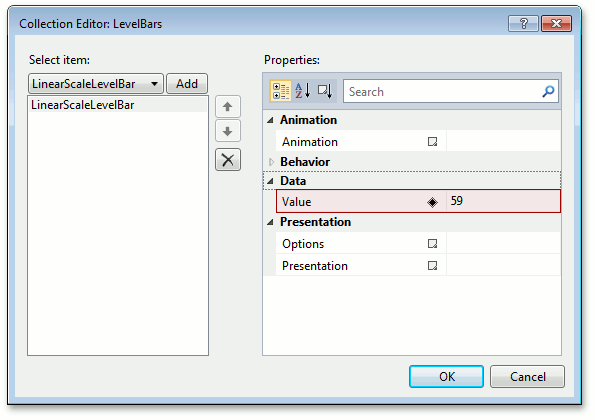
Now let’s add a level bar that is used to indicate the current temperature. For this, add a new LinearScaleLevelBar object to the LinearScale.LevelBars collection, and set its ValueIndicatorBase.Value property to 59.
- Add a new LinearScaleLayer object to the LinearScale.Layers property.
After that our XAML for the first scale will look as follows.
<dxga:LinearGaugeControl.Scales>
      <dxga:LinearScale StartValue="-40" EndValue="120"
                        MajorIntervalCount="8" Width="60">
          <dxga:LinearScale.Layers>
              <dxga:LinearScaleLayer />
          </dxga:LinearScale.Layers>
          <dxga:LinearScale.LevelBars>
              <dxga:LinearScaleLevelBar Value="59" />
          </dxga:LinearScale.LevelBars>
      </dxga:LinearScale>
  </dxga:LinearGaugeControl.Scales>
And the gauge control will be similar to the following.
Step 3. Add a Secondary Scale
In many cases some thermometers display two scales - to the left and to the right of the level bar - to better indicate the current value. In this step we will demonstrate how to add a secondary scale to create a similar thermometer.
- Add one more LinearScale object to the LinearGaugeControl.Scales collection of LinearGaugeControl.
- For the newly added secondary scale, make the same adjustments as you did for the first scale (set Scale.StartValue to -40, Scale.EndValue to 120, Scale.MajorIntervalCount to 8).
- Also, modify the following properties of a secondary scale: ScaleLabelOptions.Offset to 3, TickmarkOptions.Offset to -16, Margin property to 68, 0, 0, 0.
After performing these actions, XAML for the second scale should look like the following.
<dxga:LinearScale StartValue="-40" EndValue="120"
                  MajorIntervalCount="8" Margin="68,0,0,0" >
    <dxga:LinearScale.LabelOptions>
        <dxga:LinearScaleLabelOptions Offset="3" />
    </dxga:LinearScale.LabelOptions>
    <dxga:LinearScale.MinorTickmarkOptions>
        <dxga:MinorTickmarkOptions Offset="-16" />
    </dxga:LinearScale.MinorTickmarkOptions>
</dxga:LinearScale>
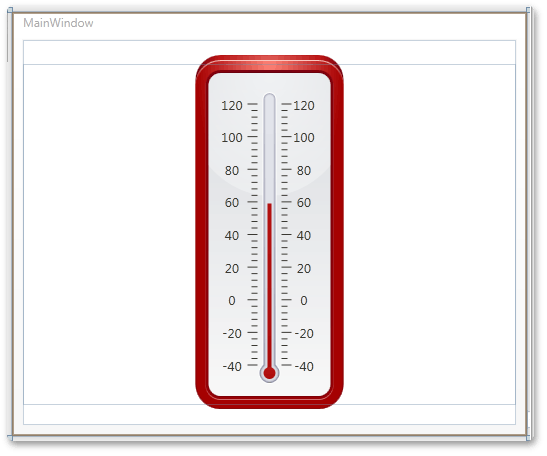
MainWindow should be similar to this.
Step 4. Add a Marker and Custom Labels
Markers are usually intended to indicate any “fixed” value on a scale. In our example, we will use a marker to display an average month temperature (e.g. New York’s temperature in May). And custom labels will be used to display units of measurement of our thermometer.
- To add a marker to the second LinearScale, locate its LinearScale.Markers property in a Properties window and click the ellipsis button. In the invoked dialog, click the Add button to add a new LinearScaleMarker object to the LinearScaleMarkerCollection.
- For the newly added marker, set its ValueIndicatorBase.Value property to 68.
- Let’s add a custom label to show the Fahrenheit symbol for the scale. To do this, add a ScaleCustomLabel object to the Scale.CustomLabels collection of the first LinearScale.
- Change a label’s ScaleCustomElement.Content to °F, ScaleCustomLabel.Value to -45 and ScaleCustomLabel.Offset to -45.
- Add a custom label to the CustomLabels collection of the secondary LinearScale and set its ScaleCustomElement.Content to °F, ScaleCustomLabel.Value to -45 and ScaleCustomLabel.Offset to -7.
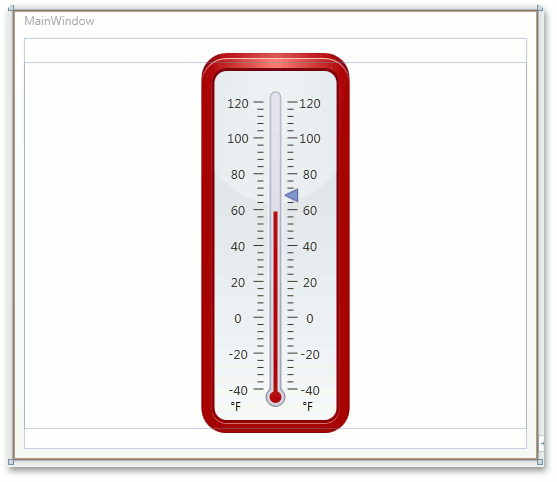
See the result.
Step 5. Specify Ranges
Ranges are intended to visually identify different intervals on a scale. On our scales, for demonstration purposes, we will show several equal ranges that indicate values lower or higher than water freezing temperature.
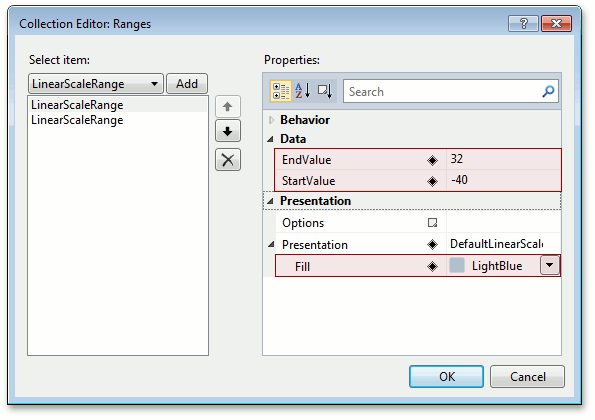
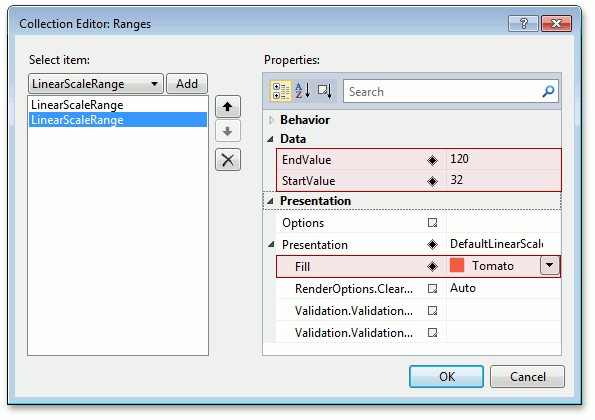
- Select the first LinearScale object, for the LinearScale.Ranges property, invoke the Ranges Collection editor and add two LinearScaleRange objects. Then set its properties as follows.
For the first range, set its RangeBase.StartValue property to -40 and RangeBase.EndValue to 32, DefaultLinearScaleRangePresentation.Fill to LightBlue.
For the secondary range, set its RangeBase.StartValue property to 32 and RangeBase.EndValue to 120, DefaultLinearScaleRangePresentation.Fill to Tomato.
- Perform the same actions for the secondary LinearScale object.
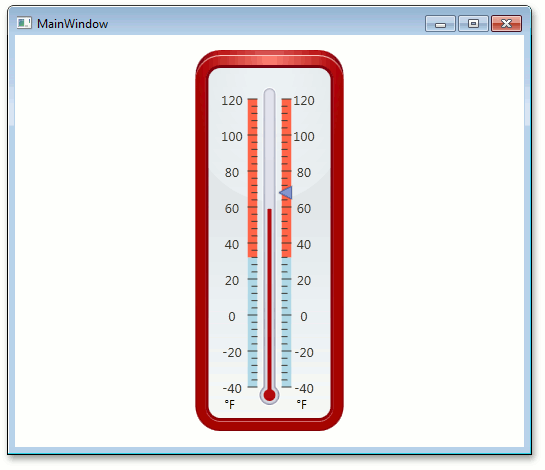
Step 6. Result
Now our Gauge control is ready.
<Window x:Class="DXGauges_Linear.MainWindow"
        xmlns="http://schemas.microsoft.com/winfx/2006/xaml/presentation"
        xmlns:x="http://schemas.microsoft.com/winfx/2006/xaml"
        xmlns:dxga="http://schemas.devexpress.com/winfx/2008/xaml/gauges"
        Title="MainWindow" Height="450" Width="525" >
    <Grid>
        <dxga:LinearGaugeControl Name="linearGaugeControl1" Margin="0,24,0,20">
            <dxga:LinearGaugeControl.Model>
                <dxga:LinearRedThermometerModel />
            </dxga:LinearGaugeControl.Model>
            <dxga:LinearGaugeControl.Scales>
                <dxga:LinearScale StartValue="-40" EndValue="120"
                                  MajorIntervalCount="8" Width="60">
                    <dxga:LinearScale.Ranges>
                        <dxga:LinearScaleRange StartValue="-40" EndValue="32">
                            <dxga:LinearScaleRange.Presentation>
                                <dxga:DefaultLinearScaleRangePresentation Fill="LightBlue" />
                            </dxga:LinearScaleRange.Presentation>
                        </dxga:LinearScaleRange>
                        <dxga:LinearScaleRange StartValue="32" EndValue="120">
                            <dxga:LinearScaleRange.Presentation>
                                <dxga:DefaultLinearScaleRangePresentation Fill="Tomato" />
                            </dxga:LinearScaleRange.Presentation>
                        </dxga:LinearScaleRange>
                    </dxga:LinearScale.Ranges>
                    <dxga:LinearScale.CustomLabels>
                        <dxga:ScaleCustomLabel Content="°F" Offset="-45" Value="-45" />
                    </dxga:LinearScale.CustomLabels>
                    <dxga:LinearScale.Layers>
                        <dxga:LinearScaleLayer />
                    </dxga:LinearScale.Layers>
                    <dxga:LinearScale.LevelBars>
                        <dxga:LinearScaleLevelBar Value="59" />
                    </dxga:LinearScale.LevelBars>
                </dxga:LinearScale>
                <dxga:LinearScale StartValue="-40" EndValue="120"
                                  MajorIntervalCount="8" Margin="68,0,0,0" >
                    <dxga:LinearScale.Ranges>
                        <dxga:LinearScaleRange StartValue="-40" EndValue="32">
                            <dxga:LinearScaleRange.Presentation>
                                <dxga:DefaultLinearScaleRangePresentation Fill="LightBlue" />
                            </dxga:LinearScaleRange.Presentation>
                        </dxga:LinearScaleRange>
                        <dxga:LinearScaleRange StartValue="32" EndValue="120">
                            <dxga:LinearScaleRange.Presentation>
                                <dxga:DefaultLinearScaleRangePresentation Fill="Tomato" />
                            </dxga:LinearScaleRange.Presentation>
                        </dxga:LinearScaleRange>
                    </dxga:LinearScale.Ranges>
                    <dxga:LinearScale.Markers>
                        <dxga:LinearScaleMarker Value="68" />
                    </dxga:LinearScale.Markers>
                    <dxga:LinearScale.CustomLabels>
                        <dxga:ScaleCustomLabel Content="°F" Offset="-7" Value="-45" />
                    </dxga:LinearScale.CustomLabels>
                    <dxga:LinearScale.MinorTickmarkOptions>
                        <dxga:MinorTickmarkOptions Offset="-16" />
                    </dxga:LinearScale.MinorTickmarkOptions>
                    <dxga:LinearScale.LabelOptions>
                        <dxga:LinearScaleLabelOptions Offset="3" />
                    </dxga:LinearScale.LabelOptions>
                </dxga:LinearScale>
            </dxga:LinearGaugeControl.Scales>
        </dxga:LinearGaugeControl>
    </Grid>
</Window>
Run the application and see the result.
Tip
A complete sample project is available in the DevExpress Code Examples database at https://supportcenter.devexpress.com/ticket/details/e3254/dxgauges-getting-started-lesson-2-create-a-linear-gauge.