Lesson 1 - Bind Chart Series to Data
- 6 minutes to read
This lesson explains how to add a series to a chart’s diagram, bind this series to a data source, and configure basic chart options.
- Step 1. Create a New Project and Add a Chart
- Step 2. Add a Data Model
- Step 3. Add a ViewModel
- Step 4. Specify the Data Context
- Step 5. Bind the Chart to Data
- Step 6. Populate the Series with Data
- Step 7. Customize the Chart
- Results
Step 1. Create a New Project and Add a Chart
- Run Microsoft Visual Studio 2012, 2013, 2015, 2017 or 2019.
- Create a new WPF Application project. Name it Lesson1BindChartToData.
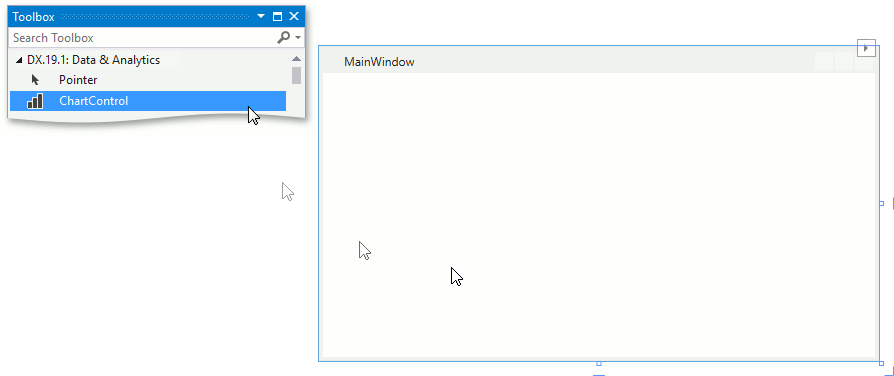
Drag the ChartControl component from the DX.19.1: Data & Analytics toolbox section to the Main Window.
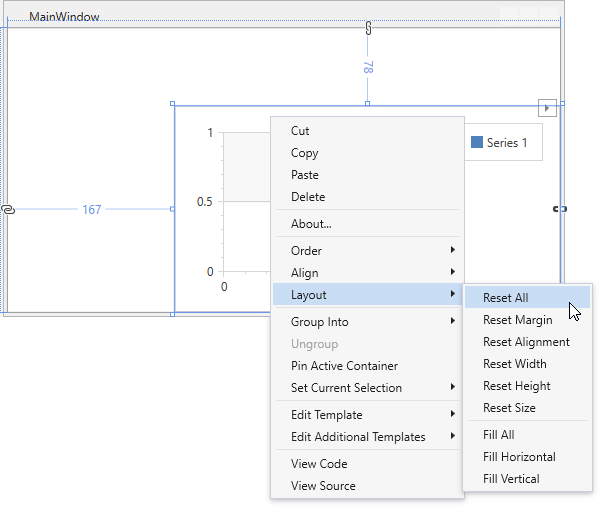
Right-click the ChartControl and select Layout | Reset All in the context menu to make the chart fill the entire window.
The newly created chart contains a blank Side-By-Side Bar and a legend. The MainWindow’s markup should appear as follows:
<Window
        xmlns="http://schemas.microsoft.com/winfx/2006/xaml/presentation"
        xmlns:x="http://schemas.microsoft.com/winfx/2006/xaml"
        xmlns:d="http://schemas.microsoft.com/expression/blend/2008"
        xmlns:mc="http://schemas.openxmlformats.org/markup-compatibility/2006"
        xmlns:local="clr-namespace:Lesson1BindChartToData"
        xmlns:dxc="http://schemas.devexpress.com/winfx/2008/xaml/charts"
        x:Class="Lesson1BindChartToData.MainWindow"
        mc:Ignorable="d"
        Title="MainWindow" Height="315" Width="560">
    <Grid>
        <dxc:ChartControl>
            <dxc:ChartControl.Legends>
                <dxc:Legend/>
            </dxc:ChartControl.Legends>
            <dxc:XYDiagram2D>
                <dxc:BarSideBySideSeries2D DisplayName="Series 1"/>
            </dxc:XYDiagram2D>
        </dxc:ChartControl>
    </Grid>
</Window>
References to the following libraries are automatically added to the project:
- DevExpress.Data.v19.1
- DevExpress.Xpf.Core.v19.1
- DevExpress.Charts.v19.1.Core
- DevExpress.Xpf.Charts.v19.1
- DevExpress.Mvvm.v19.1
- DevExpress.Xpf.Printing.v19.1
- DevExpress.Printing.v19.1.Core
Note
The references are chosen from the Global Assembly Cache (GAC). To copy them locally or include them later in your product’s installation, use the following directory:
C:\Program Files (x86)\DevExpress 19.1\Components\Bin\Framework\
Step 2. Prepare a Data Model
You can bind the chart to a database, to an XML file or data created at runtime. The data source should implement the IEnumerable, IListSource or their descendants. Refer to the Providing Data section to for more information about how to populate a chart with data. In this topic, you bind a chart to an ObservableCollection<T>.
Use the DataPoint class implementation to develop a Data Model:
using System.Collections.ObjectModel;
using System.Windows;

namespace Lesson1BindChartToData {
    public class DataPoint {
        public string Argument { get; set; }
        public double Value { get; set; }
        public static ObservableCollection<DataPoint> GetDataPoints() {
            return new ObservableCollection<DataPoint> {
                    new DataPoint { Argument = "Asia", Value = 5.289D},
                    new DataPoint { Argument = "Australia", Value = 2.2727D},
                    new DataPoint { Argument = "Europe", Value = 3.7257D},
                    new DataPoint { Argument = "North America", Value = 4.1825D},
                    new DataPoint { Argument = "South America", Value = 2.1172D}
                   };
        }
    }
}
Step 3. Add a ViewModel
Use the code below to implement the MainWindowViewModel class:
using System.Collections.ObjectModel;
using System.Windows;

namespace Lesson1BindChartToData {
    public class MainWindowViewModel {
        public ObservableCollection<DataPoint> Data { get; private set; }
        public MainWindowViewModel() {
            this.Data = DataPoint.GetDataPoints();
        }
    }
}
Step 4. Specify the Data Context
Build the solution.
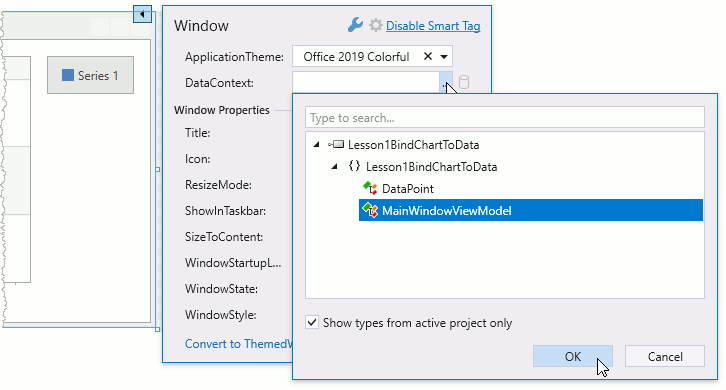
Click the MainWindow’s smart tag and specify the DataContext property as shown below:
Step 5. Bind the Chart to Data
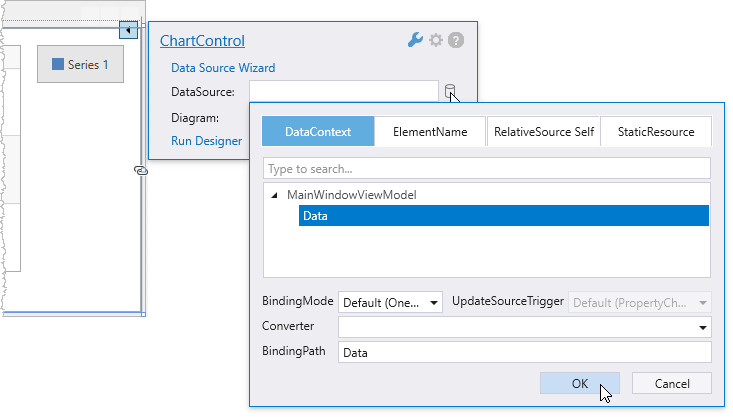
Click the Chart Control’s smart tag. Specify the ChartControl.DataSource property as the following image shows:
Step 6. Populate the Series with Data
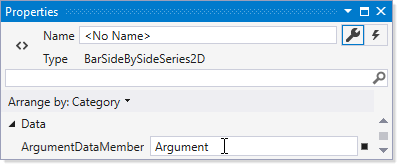
Specify the data source’s fields that should provide values for series point arguments and values.
Set the series’s Series.ArgumentDataMember property to Argument.
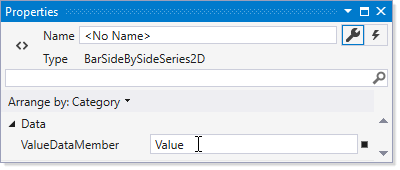
Set the series’s Series.ValueDataMember property to Value.
Step 7. Customize the Chart
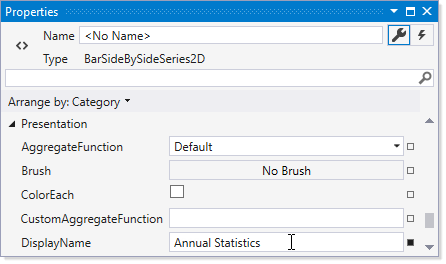
Specify the Series Name
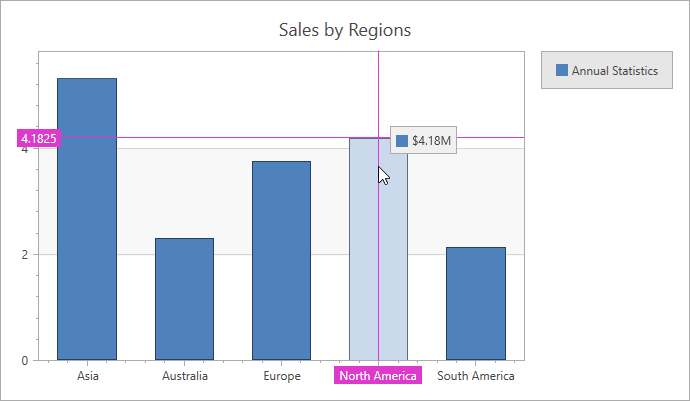
Set the Series.DisplayName property to Annual Statistics. The display name identifies the series in the legend.
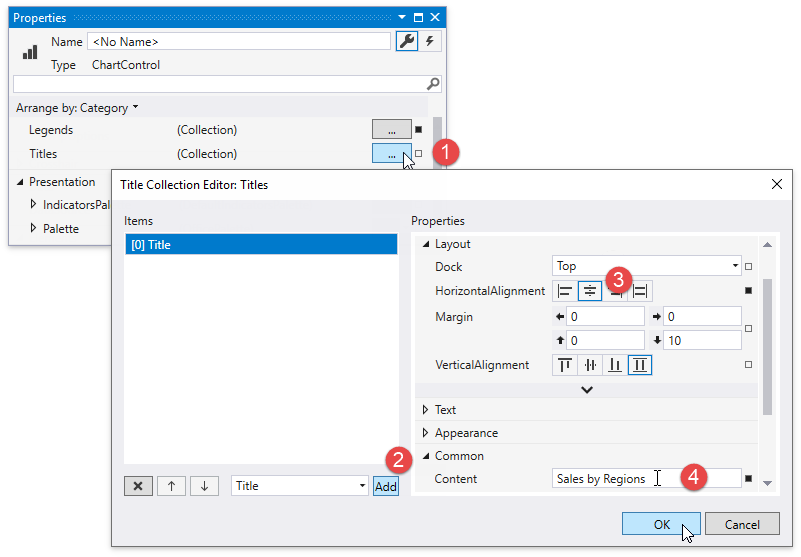
Add a Chart Title and Customize Its Position
Click the Chart Control Titles property’s ellipsis button to invoke the title collection editor. Use the Add button to create new title and add it to the chart.
Set the TitleBase.HorizontalAlignment property to Center.
Define TitleBase.Content to Sales by Regions. Click OK.
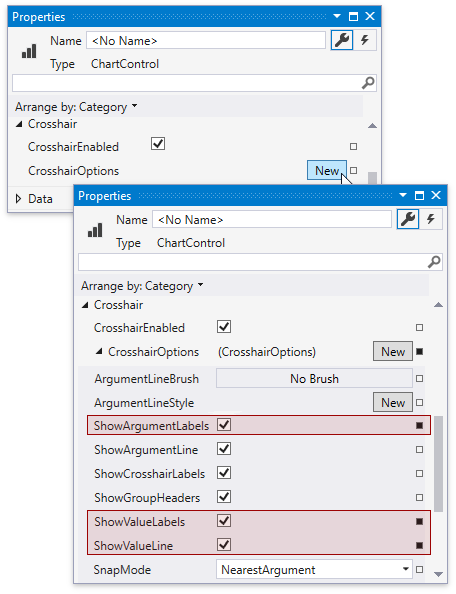
Configure the Crosshair Cursor’s Options
To customize crosshair options, click the ChartControl.CrosshairOptions property’s New button to create a CrosshairOptions instance.
Enable the following properties:
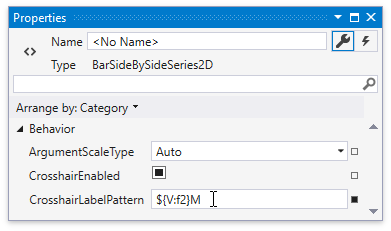
Set XYSeries2D.CrosshairLabelPattern to ${V:f2}M.
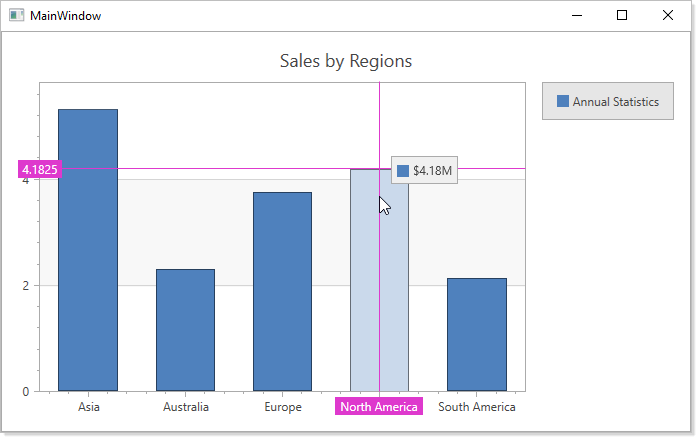
Results
Run the project to see the results.
The resulting code looks as follows:
Markup
<Window
    xmlns="http://schemas.microsoft.com/winfx/2006/xaml/presentation"
    xmlns:x="http://schemas.microsoft.com/winfx/2006/xaml"
    xmlns:d="http://schemas.microsoft.com/expression/blend/2008"
    xmlns:mc="http://schemas.openxmlformats.org/markup-compatibility/2006"
    xmlns:local="clr-namespace:Lesson1BindChartToData"
    xmlns:dxc="http://schemas.devexpress.com/winfx/2008/xaml/charts"
    xmlns:dx="http://schemas.devexpress.com/winfx/2008/xaml/core"
    x:Class="Lesson1BindChartToData.MainWindow"
    mc:Ignorable="d" Title="MainWindow" Height="400" Width="650">
    <Window.DataContext>
        <local:MainWindowViewModel/>
    </Window.DataContext>
    <Grid>
        <dxc:ChartControl DataSource="{Binding Data}">
            <dxc:ChartControl.CrosshairOptions>
                <dxc:CrosshairOptions ShowArgumentLabels="True"
                                      ShowValueLabels="True"
                                      ShowValueLine="True"/>
            </dxc:ChartControl.CrosshairOptions>
            <dxc:ChartControl.Titles>
                <dxc:Title Content="Sales by Regions"
                           HorizontalAlignment="Center"/>
            </dxc:ChartControl.Titles>
            <dxc:ChartControl.Legends>
                <dxc:Legend/>
            </dxc:ChartControl.Legends>
            <dxc:XYDiagram2D>
                <dxc:BarSideBySideSeries2D DisplayName="Annual Statistics"
                                           ArgumentDataMember="Argument"
                                           ValueDataMember="Value"
                                           CrosshairLabelPattern="${V:f2}M"/>
            </dxc:XYDiagram2D>
        </dxc:ChartControl>
    </Grid>
</Window>
Code-Behind
using System.Collections.ObjectModel;
using System.Windows;
namespace Lesson1BindChartToData {
    /// <summary>
    /// Interaction logic for MainWindow.xaml
    /// </summary>
    public partial class MainWindow : Window {
        public MainWindow() {
            InitializeComponent();
        }
    }
    public class MainWindowViewModel {
        public ObservableCollection<DataPoint> Data { get; private set; }
        public MainWindowViewModel() {
            this.Data = DataPoint.GetDataPoints();
        }
    }
    public class DataPoint {
        public string Argument { get; set; }
        public double Value { get; set; }
        public static ObservableCollection<DataPoint> GetDataPoints() {
            return new ObservableCollection<DataPoint> {
                    new DataPoint { Argument = "Asia", Value = 5.289D},
                    new DataPoint { Argument = "Australia", Value = 2.2727D},
                    new DataPoint { Argument = "Europe", Value = 3.7257D},
                    new DataPoint { Argument = "North America", Value = 4.1825D},
                    new DataPoint { Argument = "South America", Value = 2.1172D}
                   };
        }
    }
}