Lesson 4 - Grid Summaries
- 3 minutes to read
The GridControl allows you to display concise information about groups of rows. For example, you can display the number of records or maximum value, etc. This is called a summary.
The summary can be calculated over all data rows (total summaries) and over data rows in a group (group summaries).
This topic will teach you how to enable data summaries for the GridControl.
- Total Summaries
- Group Summaries
- Summary Types (Aggregate Functions)
- Adding Summary to a GridControl
- Applying Summaries by End-Users
Total Summaries
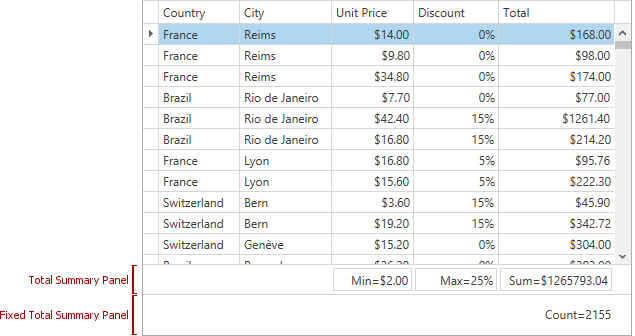
A total summary is a value of an aggregate function calculated over all data rows within a View and displayed within a summary panel.
Learn more: Total Summary
Group Summaries
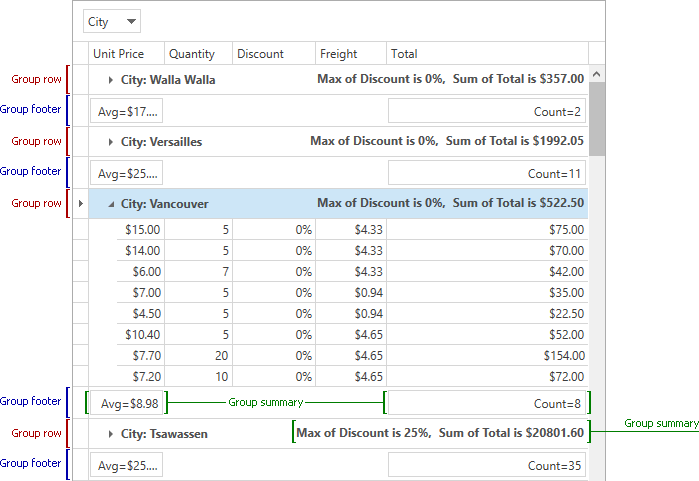
A group summary represents a value of the aggregate function calculated over all data rows within a group. Group summaries are displayed within group rows or group footers.
Learn more: Group Summary
Summary Types (Aggregate Functions)
Total summaries and group summaries provide five predefined aggregate functions. These functions allow you to calculate:
- the number of data rows (Count);
- the maximum and minimum values (MAX and MIN);
- the sum and the average value (SUM and AVG).
Learn more: Custom Summary
Adding Summary to a GridControl
You can add a summary to your GridControl by populating the GridControl.TotalSummary or GridControl.GroupSummary collection for total and group summaries respectively
To add a summary at design time, perform the following steps.
Navigate to the GridControl properties, expand the “Data” section.
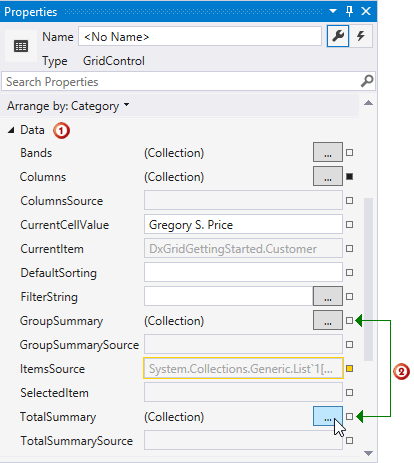
- Open the required data summary editor (GroupSummary or TotalSummary)
In the opened GridSummaryItem Collection Editor:
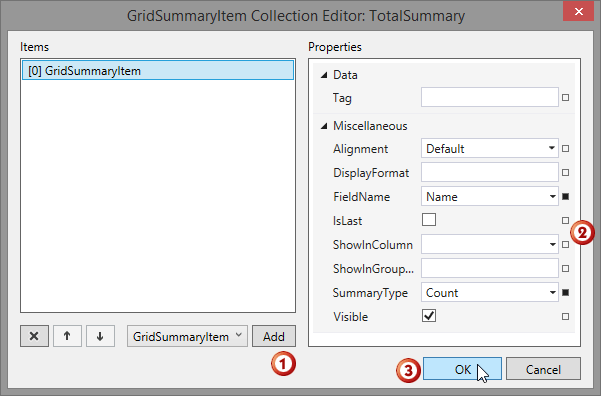
- add a new GridSummaryItem;
- define its FieldName and SummaryType properties;
- apply changes by clicking OK.
The code example below demonstrates the applied changes in XAML code.
<dxg:GridControl AutoGenerateColumns="AddNew" EnableSmartColumnsGeneration="True" ItemsSource="{Binding Customers}">
    <dxg:GridControl.TotalSummary>
        <dxg:GridSummaryItem FieldName="Name" SummaryType="Count"/>
    </dxg:GridControl.TotalSummary>
    <dxg:GridControl.Columns>
        ...
    </dxg:GridControl.Columns>
    <dxg:GridControl.View>
        <dxg:TableView AllowPerPixelScrolling="True" ShowTotalSummary="True"/>
    </dxg:GridControl.View>
</dxg:GridControl>
Run the application. The image below illustrates the result.
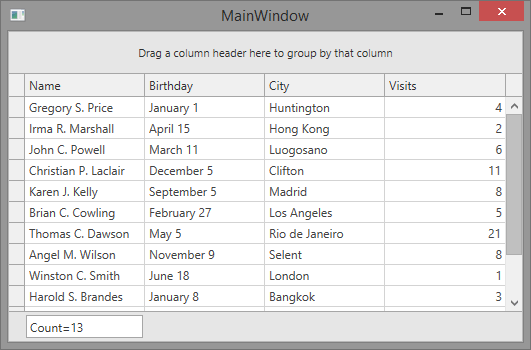
In this tutorial, the total summary is calculated by the values of the “Name” column that is defined using the FieldName property. The SummaryType property defines the aggregate function used to calculate the total summary value. In this tutorial, the SummaryType property value is set to Count, which means the total summary displays the number of data rows.
Applying Summaries by End-Users
To add or change the summary for a specific column, your end-user should right-click a region within a group footer or grid footer under a specific column. This will invoke a context menu displaying a list of supported summary types. Your end-user needs to select the required summary type in the context menu.