Pie and Donut Series
The Pie and Donut series are used to compare the percentage values of different point arguments in the same series. These charts may be useful to determine which point value or values in the point series is/are the most significant.
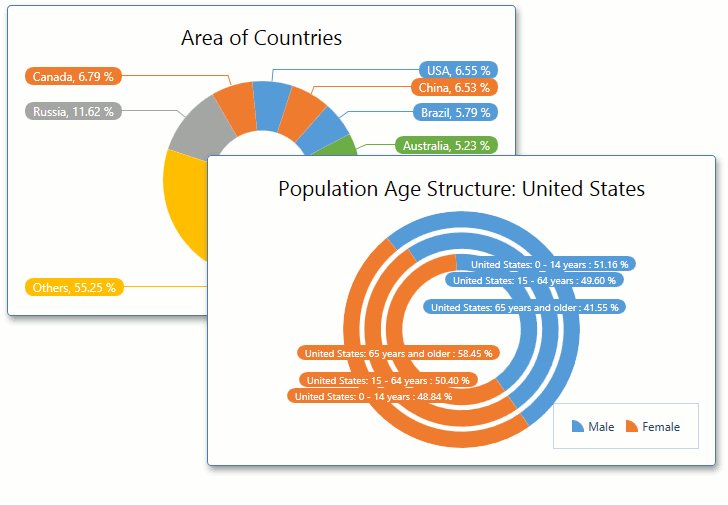
Below is a list of all such charts currently available.
| |
|


To learn about other series types that can be plotted together with Pie and Donuts, see Series Types Compatibility.