Bar Series
The Bar series are used to display series as sets of vertical bars (or columns) that are grouped by category. Values are represented by the length of the bars as measured by the Y-axis. Category labels are displayed on the X-axis. Bar charts are typically used to compare values in different categories.
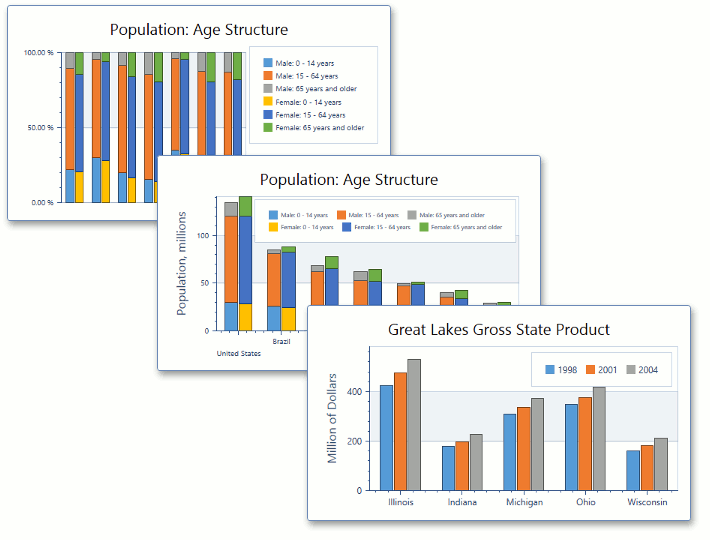
Below is a list of all bar charts that are currently available.
| |
| |
| |
| |
| |
| |
| |
|


To learn about other series types that can be plotted together with Bars, see Series Types Compatibility.