Display Top N Values
- 3 minutes to read
Pivot Grid allows you to limit the number of field values to the specified number of topmost values according to the sort order. This can be useful if an end-user does not wish to browse an entire report, and only needs to see the best or worst results. The other values are hidden and are not used to calculate totals.
To restrict the number of field values displayed along a column or row axis, use the PivotGridField.TopValueCount property. By default, this property specifies the absolute number of field values. For example, if there are 20 unique field values and this property is set to 10, only the 10 top field values will be displayed.
If the PivotGridField.TopValueType property is set to FieldTopValueType.Percent, the PivotGridField.TopValueCount property allows you to specify the number of displayed field values as a percentage ratio.
The meaning of this percentage ratio depends on the current data binding mode as follows.
- In a regular data binding mode, the PivotGridField.TopValueCount property value defines the percentage of the displayed field values among all field values. For instance, if the PivotGridField.TopValueCount property is set to 50, PivotGridControl will display the first half of field values in the current field.
- In an OLAP mode, PivotGridControl will display top values, whose cumulative total is equal to or greater than a specified percentage. For instance, if the PivotGridField.TopValueCount property is set to 50, PivotGridControl will display values whose cumulative total is not less than a half of the Grand Total value.
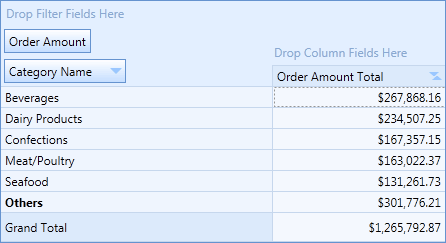
To display the remaining values combined into a single item (‘Others’), set the field’s PivotGridField.TopValueShowOthers property to true. The ‘Others’ item is displayed below field values.
Note
In an OLAP mode, totals are calculated against all values, even if the Top N Values feature is enabled.
Example: How to Display Top N Values
This example demonstrates how to avoid browsing an entire report, but only show the best or worst results. For this purpose, the PivotGridControl provides the Top N Values feature, which can be used to limit the number of displayed field values to the specified number of topmost values according to the sort order.
To enable this feature, the PivotGridField.TopValueCount property must be used. This property allows you to restrict the number of field values that are displayed along the column or row axis.
Note
A complete sample project is available at https://github.com/DevExpress-Examples/how-to-display-top-n-values-e2142.
<Window x:Class="HowToBindToMDB.MainWindow"
        xmlns="http://schemas.microsoft.com/winfx/2006/xaml/presentation"
        xmlns:x="http://schemas.microsoft.com/winfx/2006/xaml"
        xmlns:dxe="http://schemas.devexpress.com/winfx/2008/xaml/editors"
        xmlns:dxpg="http://schemas.devexpress.com/winfx/2008/xaml/pivotgrid"
        Title="MainWindow" Height="350" Width="525"  Loaded="Window_Loaded">
    <Grid Margin="7">
        <dxpg:PivotGridControl HorizontalAlignment="Left" Name="pivotGridControl1"
                               VerticalAlignment="Top">
            <dxpg:PivotGridControl.Fields>
                <dxpg:PivotGridField x:Name="fieldCountry" FieldName="Country" Area="RowArea"/>
                <dxpg:PivotGridField x:Name="fieldCustomer" FieldName="Sales Person" Area="RowArea"
                                     SortByField="{Binding ElementName=fieldExtendedPrice}"
                                     Caption="Customer" TopValueCount="3"
                                     TopValueShowOthers="True"
                                     SortOrder="Descending"/>
                <dxpg:PivotGridField x:Name="fieldExtendedPrice" FieldName="Extended Price"
                                     Area="DataArea" CellFormat="c0" />
            </dxpg:PivotGridControl.Fields>
        </dxpg:PivotGridControl>
    </Grid>
</Window>