Grouping
- 3 minutes to read
By default, all unique field values of column and row fields are listed along the pivot grid’s top and left edges. These values represent column and row headers - the report’s axes.
The grouping feature allows field values to be grouped into categories (ranges). This is useful for representing date-time and numeric data. For instance, values of a column or row field which displays dates, can be grouped by years, months, quarters, etc. Numeric values can be grouped into numeric ranges. String values can be grouped by the starting characters.
The following image shows two Pivot Grid controls. The first control displays the original data before it’s grouped. The second control groups values of the ‘Year’ column field by years.
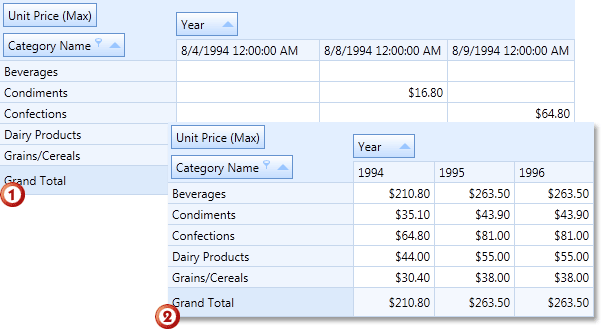
To specify the grouping mode, use the field’s PivotGridField.GroupInterval property. If the field contains numeric values, use the PivotGridField.GroupIntervalNumericRange property to specify the length of the intervals. For instance, if this property is set to 10, the values are arranged into the following intervals: 0-9, 10-19, 20-29, etc.
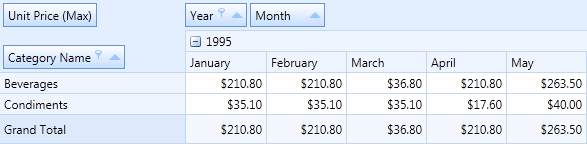
Multiple fields in the DXPivotGrid control can be bound to the same field in a data source. The values of these fields can be grouped independently. For instance, it’s possible to create two fields and bind them to the ‘OrderDate’ field in the data source. The first field can group data by years, the second field - by months, as shown in the image below:
To group field values using a custom rule, handle the PivotGridControl.CustomGroupInterval event.
Example: How to Group Date-Time Values
This example shows how to group date-time values.
<Window x:Class="HowToBindToMDB.MainWindow"
        xmlns="http://schemas.microsoft.com/winfx/2006/xaml/presentation"
        xmlns:x="http://schemas.microsoft.com/winfx/2006/xaml"
        xmlns:dxpg="http://schemas.devexpress.com/winfx/2008/xaml/pivotgrid"
        Title="MainWindow" Height="350" Width="525"  Loaded="Window_Loaded">
    <Grid>
        <dxpg:PivotGridControl HorizontalAlignment="Left" Name="pivotGridControl1"
                               VerticalAlignment="Top">
            <dxpg:PivotGridControl.Fields>
                <dxpg:PivotGridField Name="fieldYear" FieldName="OrderDate" Area="RowArea"
                                     Caption="Year" GroupInterval="DateYear" />
                <dxpg:PivotGridField Name="fieldQuarter" FieldName="OrderDate" Area="RowArea"
                                     Caption="Quarter" GroupInterval="DateQuarter"
                                     ValueFormat="Qtr {0}" />
                <dxpg:PivotGridField Name="fieldMonth" FieldName="OrderDate" Area="RowArea"
                                     Caption="Month" GroupInterval="DateMonth" />
                <dxpg:PivotGridField Name="fieldExtendedPrice" FieldName="Extended Price"
                                     Area="DataArea" CellFormat="c0" />
            </dxpg:PivotGridControl.Fields>
        </dxpg:PivotGridControl>
    </Grid>
</Window>