Summary Overview
- 2 minutes to read
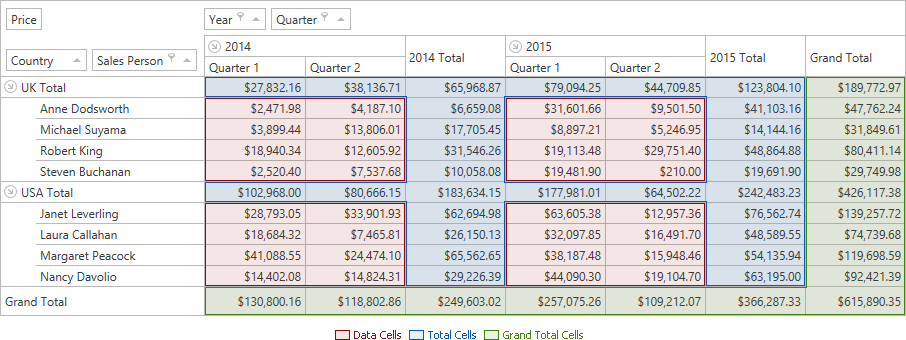
Cells in the Pivot Grid control display the results of summaries calculated against data fields. Summaries are calculated for a subset of records from the grid’s underlying data source. All the records in this subset have matching values in a column field(s) and row field(s) and these values are identified by column and row headers. Summary values are displayed within cells in the Data Area.
The DXPivotGrid supports two types of summaries:
- Automatic summaries
The Pivot Grid control uses summary calculation methods like Sum, Average, Count, Min, Max, and so on against such data fields. Use the PivotGridField.SummaryType property to specify the type of the summary function.
The String and DateTime types do not support arithmetic addition. For fields that do not contain numeric data only the following summary functions can be calculated:
Count,Min, andMax. If the field’sSummaryTypeproperty is set to any other value, the corresponding data cells displays0. The numeric data fields support all available summary function types.- Custom summaries
- This summaries allow you to manually calculate summaries using custom algorithms. For instance, you can involve multiple data fields in summary calculation or calculate a summary for individual records.
For information on how to obtain summary values, see Accessing Summary Values and Obtaining Underlying Data.