Integration with the Chart Control
- 4 minutes to read
The ChartControl can load and visualize data directly from the PivotGridControl control. The Pivot Grid contains a specific option set that configures how it provides its data. This guide explains how to configure the Pivot Charting bundle containing the Pivot Grid control and the Chart Control.
This topic contains the following sections:
Pivot Grid Data Providing Basics
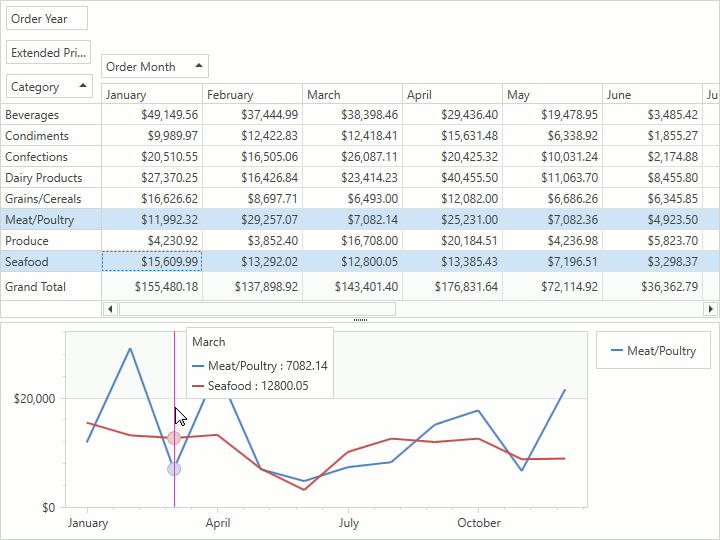
The following code snippet demonstrates how to automatically create a Chart’s series visualizing the Pivot Grid’s data that the PivotGridControl.ChartDataSource property provides:
<dxpg:PivotGridControl x:Name="pivotGridControl"
                       ChartProvideDataByColumns="True"
                       ChartSelectionOnly="True">
    <!-- Pivot Grid Configuration-->
</dxpg:PivotGridControl>
<dxc:ChartControl DataSource="{Binding ElementName=pivotGridControl, Path=ChartDataSource}">
    <!-- ChartDataSource  provides three data members whose names -->
    <!-- should be assigned to the Chart's data member properties for correct data visualization: -->
    <!-- "Series" to the SeriesDataMember property, "Arguments" to ArgumentDataMember -->
    <!-- and "Values" to ValueDataMember. -->
    <dxc:XYDiagram2D SeriesDataMember="Series">
        <dxc:XYDiagram2D.SeriesTemplate>
            <dxc:LineSeries2D ArgumentDataMember="Arguments"
                              ValueDataMember="Values"/>
        </dxc:XYDiagram2D.SeriesTemplate>
    </dxc:XYDiagram2D>
</dxc:ChartControl>
The following Pivot Grid options configure how the Pivot Grid initializes its chart data source:
| Property | Description |
|---|---|
| Incoming Data Format | |
| PivotGridControl.ChartProvideDataByColumns | Specifies whether the Pivot Grid initializes its Chart Data Source items’ Series field using column values. |
| PivotGridControl.ChartProvideEmptyCells | Specifies whether the Pivot Grid provides Chart Data Source items generated by cells that have empty values. |
| PivotGridControl.ChartFieldValuesProvideMode | Specifies the value indicating which field values the Pivot Grid passes to a Chart. |
| PivotGridControl.ChartProvideCellValuesAsType | Gets or sets the type to which Pivot Chart converts cell values to export them to a Chart. |
| PivotGridControl.ChartProvideColumnFieldValuesAsType | Gets or sets the type to which Pivot Chart converts column field values to export them to a Chart. |
| PivotGridControl.ChartProvideRowFieldValuesAsType | Gets or sets the type to which Pivot Chart converts row field values to export them to a Chart. |
| Pivot Grid Totals Treatment | |
| PivotGridControl.ChartProvideColumnCustomTotals | Gets or sets whether column custom totals should be passed to a chart control. This is a dependency property. |
| PivotGridControl.ChartProvideColumnGrandTotals | Gets or sets whether column grand totals are passed to a chart control. This is a dependency property. |
| PivotGridControl.ChartProvideColumnGrandTotals | Gets or sets whether column grand totals are passed to a chart control. This is a dependency property. |
| PivotGridControl.ChartProvideRowCustomTotals | Gets or sets whether row custom totals should be displayed in a chart control. This is a dependency property. |
| PivotGridControl.ChartProvideRowGrandTotals | Gets or sets whether row grand totals are passed to a chart control. This is a dependency property. |
| PivotGridControl.ChartProvideRowTotals | Gets or sets whether row totals are passed to a chart control. This is a dependency property. |
| Limiting the Series and Point Number | |
| PivotGridControl.ChartMaxPointCountInSeries | Gets or sets the maximum allowed number of points in a series. This is a dependency property. |
| PivotGridControl.ChartMaxSeriesCount | Gets or sets the maximum allowed number of series in the chart data source. This is a dependency property. |
| Additional options | |
| PivotGridControl.ChartSelectionOnly | Gets or sets whether a chart control should visualize data from the selected cells only. |
| PivotGridControl.ChartUpdateDelay | Gets or sets the delay between changing the cell focus or selection, and updating the bound Chart control. This is a dependency property. |
Note
The PivotGridControl.ChartMaxSeriesCount and PivotGridControl.ChartMaxPointCountInSeries properties’ default values limit series’ and series points’ count. Set these properties to 0 to remove the limit.
Data Providing Specifics
The Pivot Grid provides its data to the Chart in the following manner if PivotGridControl.ChartProvideDataByColumns property is set to true:
- The values of data members specifying columns to the ChartDataSource item’s Series values.
- The values of data members specifying rows to the ChartDataSource item’s Argument values.
- The summarized values to the ChartDataSource item’s Series values.
Otherwise:
- The values of data members specifying rows to the ChartDataSource item’s Series values.
- The values of data members specifying columns to the ChartDataSource item’s Argument values.
- The summarized values to the ChartDataSource item’s Series values.
If multiple fields identify a column/row, the respective field values connected by the ‘|’ sign construct the corresponding data member value (for example, ‘1995 | January’).
When a Pivot Grid contains multiple data fields with different data types (PivotGridField.DataType), it converts cell values to Decimal if possible; otherwise it sets its cell values to 0. Use the PivotGridControl.ChartProvideCellValuesAsType property to override this behavior specifying a data type to which cell values should be converted.
The ChartControl supports only Numeric and DateTime series point values (see Series Scale Types to learn more). To convert cell values into an appropriate type manually, handle the PivotGridControl.CustomChartDataSourceData event.
When choosing a Chart type, note that only Series with a single value per Series point are supported.