How to: Create a 2D Point Chart
- 3 minutes to read
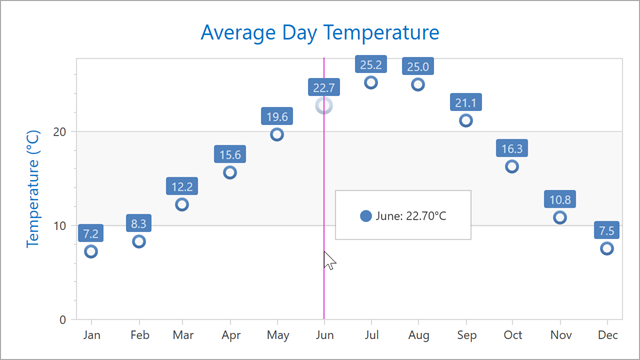
This example shows how to create a 2D Point chart and configure its titles, label format, axes, and appearance.
Follow the steps below to create a 2D Point chart:
Create a ChartControl and set its
DataContextproperty to a ViewModel.Set the chart’s Diagram property to an XYDiagram2D object.
Add a PointSeries2D to the diagram’s Series collection.
Specify the following series parameters to bind the series to data:
For more information about series, refer to the following topic: Series.
Set the Series.LabelsVisibility property to
Trueto display point labels. Specify the SeriesLabel.TextPattern property to format labels.Use the XYDiagram2D.AxisX and XYDiagram2D.AxisY properties to customize axes (scale options, title, and labels). Refer to the following help topic for more information about axes: Axes.
Add a Title object to the ChartControl.Titles collection, and specify title content. Refer to the following topic for more information about titles: Chart Titles.
<Window x:Class="Point2DChart.Window1"
xmlns="http://schemas.microsoft.com/winfx/2006/xaml/presentation"
xmlns:x="http://schemas.microsoft.com/winfx/2006/xaml"
xmlns:dxc="http://schemas.devexpress.com/winfx/2008/xaml/charts"
xmlns:local ="clr-namespace:Point2DChart"
Title="Window1" Height="350" Width="620">
<Grid>
<dxc:ChartControl Name="chartControl1">
<dxc:ChartControl.DataContext>
<local:ChartViewModel/>
</dxc:ChartControl.DataContext>
<dxc:ChartControl.Diagram>
<dxc:XYDiagram2D>
<dxc:XYDiagram2D.Series>
<dxc:PointSeries2D DisplayName="Day Temperature"
DataSource="{Binding DataPoints}"
ArgumentScaleType="DateTime"
ArgumentDataMember="Time"
ValueDataMember="Value"
LabelsVisibility="True"
CrosshairLabelPattern="{}{A:MMMM}: {V:f2}°C"
MarkerSize="14">
<dxc:PointSeries2D.MarkerModel>
<dxc:RingMarker2DModel/>
</dxc:PointSeries2D.MarkerModel>
<dxc:PointSeries2D.Label>
<dxc:SeriesLabel TextPattern="{}{V:f1}"
dxc:MarkerSeries2D.Angle="90"
ConnectorVisible="False"/>
</dxc:PointSeries2D.Label>
</dxc:PointSeries2D>
</dxc:XYDiagram2D.Series>
<dxc:XYDiagram2D.AxisX>
<dxc:AxisX2D TickmarksMinorVisible="False">
<dxc:AxisX2D.WholeRange>
<dxc:Range SideMarginsValue="10"/>
</dxc:AxisX2D.WholeRange>
<dxc:AxisX2D.Label>
<dxc:AxisLabel TextPattern="{}{A:MMM}"/>
</dxc:AxisX2D.Label>
<dxc:AxisX2D.DateTimeScaleOptions>
<dxc:ManualDateTimeScaleOptions GridSpacing="1"
GridAlignment="Month"
AutoGrid="False"/>
</dxc:AxisX2D.DateTimeScaleOptions>
</dxc:AxisX2D>
</dxc:XYDiagram2D.AxisX>
<dxc:XYDiagram2D.AxisY>
<dxc:AxisY2D>
<dxc:AxisY2D.Title>
<dxc:AxisTitle Content="Temperature (°C)"/>
</dxc:AxisY2D.Title>
</dxc:AxisY2D>
</dxc:XYDiagram2D.AxisY>
</dxc:XYDiagram2D>
</dxc:ChartControl.Diagram>
<dxc:ChartControl.Titles>
<dxc:Title Dock="Top"
HorizontalAlignment="Center"
Content="Average Day Temperature"/>
</dxc:ChartControl.Titles>
</dxc:ChartControl>
</Grid>
</Window>
using System;
using System.Collections.Generic;
using System.Windows;
namespace Point2DChart {
    public class ChartViewModel {
        List<DataPoint> dataPoints;
        public List<DataPoint> DataPoints {
            get {
                if (dataPoints == null) {
                    dataPoints = new List<DataPoint> {
                            new DataPoint (new DateTime(2019, 1, 1), 7.2),
                            new DataPoint (new DateTime(2019, 2, 1), 8.3),
                            new DataPoint (new DateTime(2019, 3, 1), 12.2),
                            new DataPoint (new DateTime(2019, 4, 1), 15.6),
                            new DataPoint (new DateTime(2019, 5, 1), 19.6),
                            new DataPoint (new DateTime(2019, 6, 1), 22.7),
                            new DataPoint (new DateTime(2019, 7, 1), 25.2),
                            new DataPoint (new DateTime(2019, 8, 1), 25),
                            new DataPoint (new DateTime(2019, 9, 1), 21.1),
                            new DataPoint (new DateTime(2019, 10, 1), 16.3),
                            new DataPoint (new DateTime(2019, 11, 1), 10.8),
                            new DataPoint (new DateTime(2019, 12, 1), 7.5)
                };
                }
                return dataPoints;
            }
        }
    }
    public class DataPoint {
        public DateTime Time { get; set; }
        public double Value { get; set; }
        public DataPoint(DateTime time, double value) {
            this.Time = time;
            this.Value = value;
        }
    }
}