How to: Create a 2D Area Chart
- 4 minutes to read
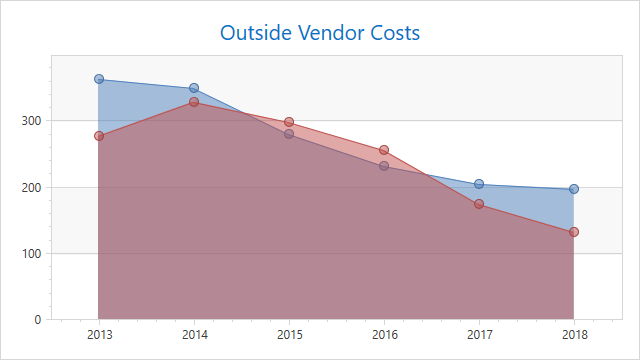
This example describes how to create a 2D Area chart.
Create a ChartControl and set its ChartControl.Diagram property to a XYDiagram2D object.
Note
The ChartControl.Diagram is a content property. You can declare a diagram in XAML directly after a chart control’s declaration without wrapping it in opening and closing ChartControl.Diagram tags.
Specify the Diagram.SeriesItemsSource property to bind a collection of objects used to generate series.
The Diagram.SeriesItemTemplate property allows you to define each series item presentation. Use the following API members to configure a series item:
Member Description AreaSeries2D Represents the 2D Area series. Series.DataSource Specifies the series’s data source. Series.ArgumentDataMember Defines the data member that provides the series’s arguments. Series.ValueDataMember Specifies the data member that provides the series’s values. Series.DisplayName Gets or sets the display name of the series. To enable series markers, use the AreaSeries2D.MarkerVisible property. The AreaSeries2D.MarkerSize property allows you to set the marker size. To specify the model used to draw markers, use the AreaSeries2D.MarkerModel property.
Add an Title to the ChartControlBase.Titles collection. Define the title’s Content and HorizontalAlignment properties. Refer to the Chart Titles topic for more information about titles.
Use the following API members to configure the axis options.
Member Description XYDiagram2D.AxisX Gets the X-axis. AxisX2D Represents the X-axis of a XYDiagram2D class. Axis.WholeRange Gets or sets the range through which it’s possible to scroll an axis. Range Contains the common settings that define the range displayed by an axis. AxisX2D.DateTimeScaleOptions Provides access to the options that define the behavior of a date-time X-scale when its mode is manual, automatic or continuous. ManualDateTimeScaleOptions Contains settings for a date-time axis data when its scale mode is manual.
<Window x:Class="Area2DChart.Window1"
        xmlns="http://schemas.microsoft.com/winfx/2006/xaml/presentation"
        xmlns:x="http://schemas.microsoft.com/winfx/2006/xaml"
        xmlns:dxc="http://schemas.devexpress.com/winfx/2008/xaml/charts"
        xmlns:local="clr-namespace:Area2DChart"
        Title="Window1" Height="420" Width="690">
    <Window.DataContext>
        <local:ChartViewModel/>
    </Window.DataContext>
    <Grid>
        <dxc:ChartControl>
            <dxc:ChartControl.Titles>
                <dxc:Title Content="Outside Vendor Costs" HorizontalAlignment="Center"/>
            </dxc:ChartControl.Titles>
            <dxc:XYDiagram2D SeriesItemsSource="{Binding Data}">
                <dxc:XYDiagram2D.SeriesItemTemplate>
                    <DataTemplate>
                        <dxc:AreaSeries2D DisplayName="{Binding Name}"
                                          DataSource="{Binding Values}"
                                          ArgumentDataMember="Argument"
                                          ValueDataMember="Value"
                                          Transparency="0.5"
                                          MarkerVisible="True"
                                          MarkerSize="10">
                            <dxc:AreaSeries2D.MarkerModel>
                                <dxc:CircleMarker2DModel/>
                            </dxc:AreaSeries2D.MarkerModel>
                        </dxc:AreaSeries2D>
                    </DataTemplate>
                </dxc:XYDiagram2D.SeriesItemTemplate>
                <dxc:XYDiagram2D.AxisX>
                    <dxc:AxisX2D>
                        <dxc:AxisX2D.WholeRange>
                            <dxc:Range SideMarginsValue="0.5"
                                       AutoSideMargins="False"/>
                        </dxc:AxisX2D.WholeRange>
                        <dxc:AxisX2D.DateTimeScaleOptions>
                            <dxc:ManualDateTimeScaleOptions MeasureUnit="Year"/>
                        </dxc:AxisX2D.DateTimeScaleOptions>
                    </dxc:AxisX2D>
                </dxc:XYDiagram2D.AxisX>
            </dxc:XYDiagram2D>
        </dxc:ChartControl>
    </Grid>
</Window>