Stock
Short Description
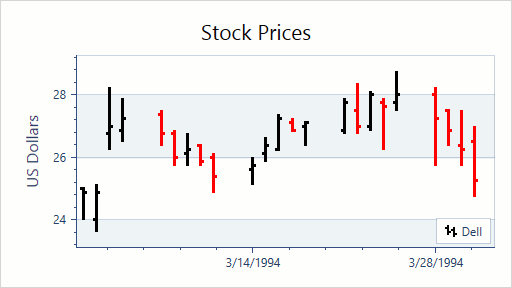
The Stock series is used to show variation in stock prices over the course of a day. The Open and Close prices are represented by left and right lines on each point, and the Low and High prices are represented by the bottom and top values of the vertical line which is shown at each point.
An example of the Stock chart is shown in the image below.
Series Characteristics
The table below lists the main characteristics of this chart type.
| Feature | Value |
|---|---|
| Series View type | StockSeries2D |
| Diagram type | XYDiagram2D |
| Number of arguments per series point | 1 |
| Number of values per series point | 4 |
For information on which series view types can be combined with the Stock view, refer to the Series Type Compatibility document.
Example
The following example demonstrates how to create a 2D Stock chart.