Series Points
- 3 minutes to read
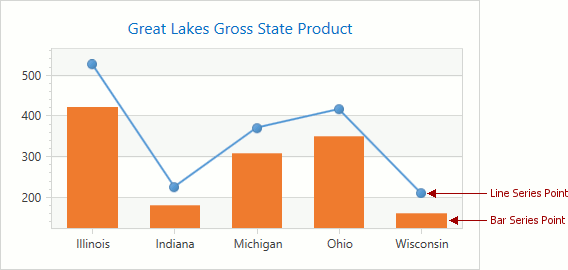
A series point is a visual element representing an individual data point. Its appearance depends on the series type.
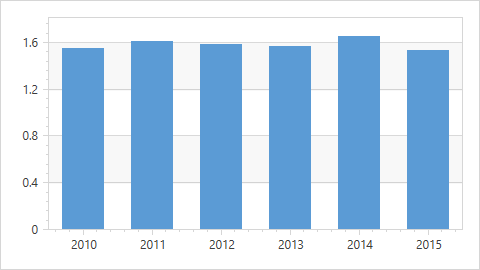
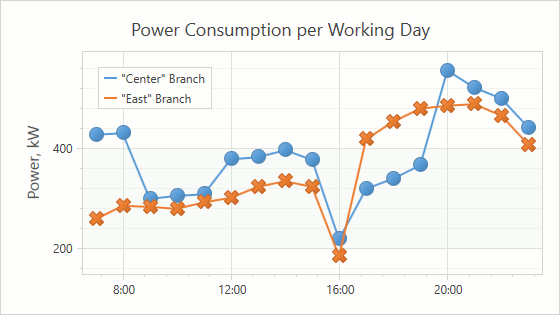
The following image shows line and bar series points:
This document consists of the following sections:
How to Manually Add a Point to a Series
You can manually add points to the series points collection. For this, you need to define a point’s argument and its associated values.
<dxc:LineSeries2D DisplayName="Line Series">
    <dxc:SeriesPoint Argument="A"
                     Value="5"/>
    <!-- Other series points. -->
</dxc:LineSeries2D>
The following table contains classes and properties that allow you to populate the Series.Points collection manually:
| Class or Property | Description |
|---|---|
| Series.Points | The series points’ collection. This is a content property. You can declare points in XAML directly after a series declaration without wrapping them in opening and closing Series.Points tags. |
| SeriesPoint | The series point. |
| SeriesPoint.Argument | The point’s argument. |
| SeriesPoint.Value | The point’s value. |
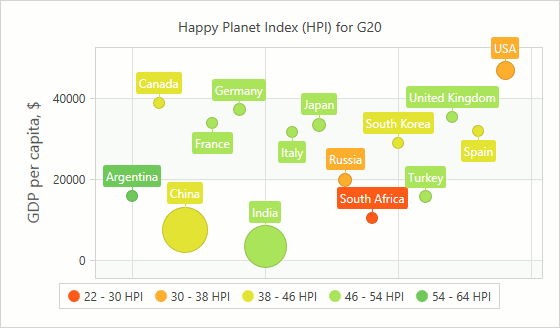
Note that a series point in a particular series type may require unique parameters, for instance, a Line series point requires an Argument and Value while a Bubble series point also requires a Weight parameter.
<dxc:BubbleSeries2D DisplayName="Planet Mass">
    <dxc:SeriesPoint Argument="Mercury"
                     Value="58"
                     dxc:BubbleSeries2D.Weight="0.06"/>
    <!-- Other series points. -->
</dxc:BubbleSeries2D>
The following table lists series that have specific Value parameters:
Series | Parameters |
|---|---|
The Chart control displays points with undefined Value parameter as breaks in Line or Area series, and missing points or bars in other series types.
Refer to the Lesson 1 - Create a Simple Chart topic for a step-by-step guide on how to create a chart and manually add points.
You can automatically populate chart with data by binding a Chart control to a data source. Refer to the Bind a Series to a Data Source document for more details.
How to Modify Point Representation
You can perform the following actions to configure chart points’ appearance and behavior:
-
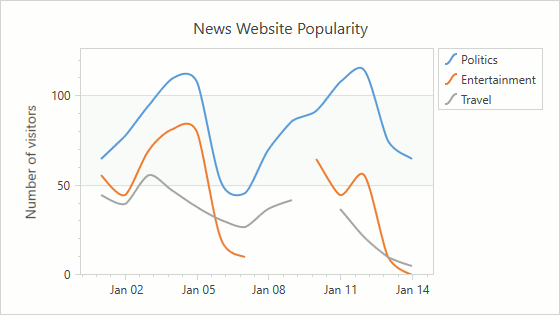
The Data Aggregation allows you to combine several series points into a single point according to the x-axis’s measurement unit interval. Specify an aggregating function to define how series points should be processed.
Non-aggregated data Aggregated data 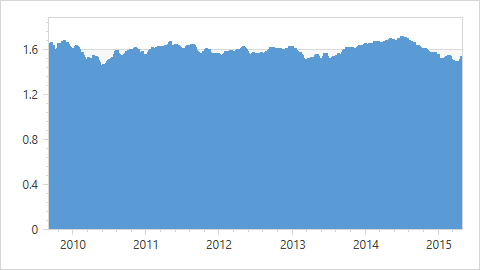
-
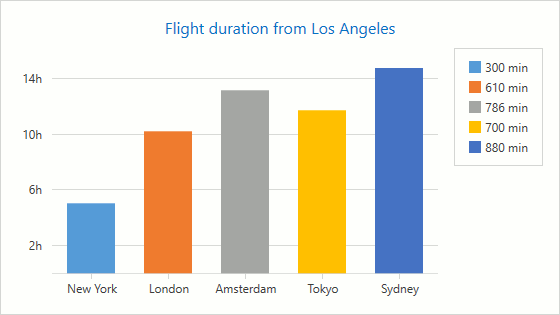
It is possible to color points using one of colorizers:
You can also enable the XYSeries.ColorEach property to draw points using different colors that ChartControlBase.Palette specifies.
-
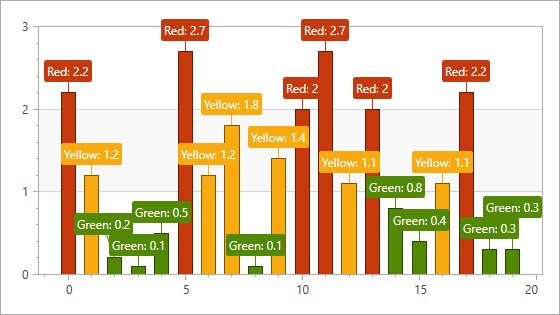
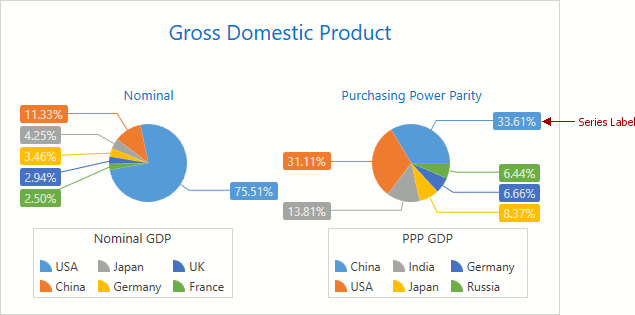
Display series point labels to provide additional information with points, such as a point argument or value.
-
You can animate series points and configure animation’s settings.
-
Modify a series model to change points’ appearance. Different series types provide a set of predefined models. You can also create a custom model for a series point.
-
Use the Custom Draw feature to configure series points’ appearance.