Series Points
- 3 minutes to read
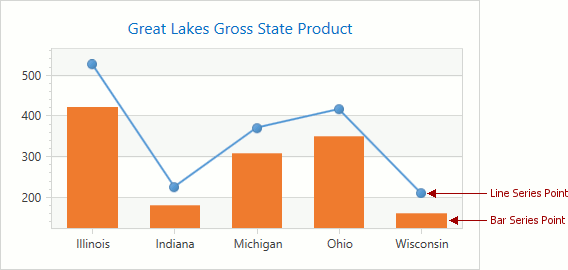
A series point is a visual element representing an individual data point. Its appearance depends on the series type.
The following image shows line and bar series points:
This document consists of the following sections:
Add a Point to a Series
You can define a point’s argument and its associated values to add points to the series points collection.
<dxc:LineSeries2D DisplayName="Line Series">
    <dxc:SeriesPoint Argument="A"
                     Value="5"/>
    <!-- Other series points. -->
</dxc:LineSeries2D>
The following table contains classes and properties that allow you to populate the Series.Points collection manually:
| Class or Property | Description |
|---|---|
| Series.Points | The series points’ collection. This is a content property. You can declare points in XAML directly after a series declaration without wrapping them in opening and closing Series.Points tags. |
| SeriesPoint | The series point. |
| SeriesPoint.Argument | The point’s argument. |
| SeriesPoint.Value | The point’s value. |
Note that a series point in a particular series type may require unique parameters, for instance, a Line series point requires an Argument and Value while a Bubble series point also requires a Weight parameter.
<dxc:BubbleSeries2D DisplayName="Planet Mass">
    <dxc:SeriesPoint Argument="Mercury"
                     Value="58"
                     dxc:BubbleSeries2D.Weight="0.06"/>
    <!-- Other series points. -->
</dxc:BubbleSeries2D>
The following table lists series that have specific Value parameters:
Series | Parameters |
|---|---|
The Chart control displays points with undefined Value parameter as breaks in Line or Area series, and missing points or bars in other series types.
You can automatically populate chart with data by binding a Chart control to a data source. Refer to the Bind a Series to a Data Source document for more details.
Modify Point Representation
You can perform the following actions to configure chart points’ appearance and behavior:
-
The Data Aggregation allows you to combine several series points into a single point according to the x-axis’s measurement unit interval. Specify an aggregating function to define how series points should be processed.
Non-aggregated data Aggregated data 

-
It is possible to color points using one of colorizers:

You can also enable the XYSeries.ColorEach property to draw points using different colors that ChartControlBase.Palette specifies.

-
Display series point labels to provide additional information with points, such as a point argument or value.

-
You can animate series points and configure animation’s settings.
-
Modify a series model to change points’ appearance. Different series types provide a set of predefined models. You can also create a custom model for a series point.

-
Use the Custom Draw feature to configure series points’ appearance.

Customize the first and last series points
You can configure markers and labels for the first and last series points to distinguish their appearance from other series points.
