Series
- 13 minutes to read
A series is a group of data points that have the same argument and value types. The series type determines the number of values that are required to define a point; it also specifies point appearance. Series can also have additional series elements that help analyze data and provide extra information; series also allow you to filter data before displaying it in a chart.
The following image displays the Area, Line and Side-by-Side Bar series in a 2D XY Diagram:
This document consists of the following sections:
- How to: Create a Series
- How to: Populate a Series with Data
- MVVM Binding
- Series Types
- Series Elements
- Colorize Series
How to: Create Series
Use one of the approaches below to add series to a chart.
Manually Create a Series
The following example shows how to add an empty series to a chart:
<dxc:ChartControl x:Name="chart">
    <dxc:XYDiagram2D>
        <dxc:PointSeries2D DisplayName="New Series"/>
    </dxc:XYDiagram2D>
</dxc:ChartControl>
The table below lists classes and properties used by the markup above:
The diagram series’ collection. The context property: you can declare series directly after a diagram’s declaration in XAML. | |
The base class for all individual series in the chart. |
Create a Series From a Data Source
The following code generates series from a data source:
<dxc:ChartControl DataSource="{Binding AnnualSales}">
    <dxc:ChartControl.DataContext>
        <local:AnnualSalesViewModel>
    </dxc:ChartControl.DataContext>
    <dxc:ChartControl.Diagram>
        <dxc:XYDiagram2D SeriesDataMember="Year">
            <dxc:XYDiagram2D.SeriesTemplate>
                <dxc:BarSideBySideSeries2D ArgumentDataMember="Region"
                                           ValueDataMember="Value"/>
            </dxc:XYDiagram2D.SeriesTemplate>
        </dxc:XYDiagram2D>
    </dxc:ChartControl.Diagram>
</dxc:ChartControl>
The markup above uses the following classes and properties:
Member | Description |
|---|---|
Gets or sets the chart control’s data source. | |
Specifies the series template settings. | |
Gets or sets the name of the data field whose values are used to automatically generate and populate series. |
The Chart control performs the following to generate series from a data source:
- Groups data source items by an item field the SeriesDataMember property specifies.
- Creates the same number of series as formed groups, and equals the number of the series data member unique values.
- Assigns a unique group for each series: Series.DisplayName set to the string representation of the SeriesDataMember value, and the series uses group items to automatically populate series with points.
How to: Populate a Series with Data
The series displays data you provide. This section describes methods you can use to populate series with data:
Manually Add Points to a Series
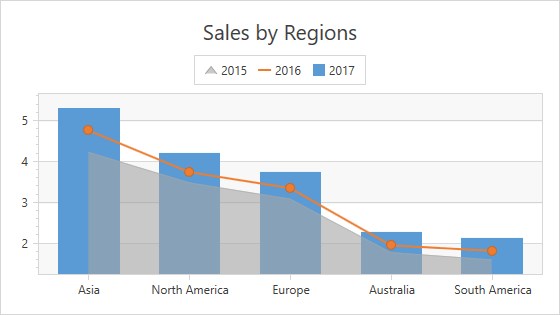
The following markup adds a Line series with five manually added series points:
<dxc:ChartControl>
    <dxc:ChartControl.DataContext>
        <local:AnnualSalesViewModel>
    </dxc:ChartControl.DataContext>
    <dxc:XYDiagram2D>
        <dxc:LineSeries2D DisplayName="2017">
            <dxc:SeriesPoint Argument="Asia" Value="5.289"/>
            <dxc:SeriesPoint Argument="North America" Value="4.182"/>
            <dxc:SeriesPoint Argument="Europe" Value="3.725"/>
            <dxc:SeriesPoint Argument="Australia" Value="2.272"/>
            <dxc:SeriesPoint Argument="South America" Value="2.117"/>
        </dxc:LineSeries2D>
    </dxc:XYDiagram2D>
</dxc:ChartControl>
The markup above uses the following classes and properties:
Member | Description |
|---|---|
The series’s collection of points. | |
An individual point. |
Note that several series require more than one Value per point to display data. These series provide attached properties to specify additional values:
Series | Attached Property |
|---|---|
|
Note that the point’s value should not be specified for the financial series. | |
Populate a series with data from a data source
The following code populates a new series with points from the item collection that the chart’s data context object provides:
<dxc:ChartControl>
    <dxc:ChartControl.DataContext>
        <local:SalesViewModel>
    <dxc:ChartControl.DataContext>
    <dxc:ChartControl.Diagram>
        <dxc:XYDiagram2D>
            <dxc:XYDiagram2D.Series>
                <dxc:BarSideBySideSeries2D DisplayName="2017"
                                           DataSource="{Binding SalesIn2017}"
                                           ArgumentDataMember="Region"
                                           ValueDataMember="Value"/>
                </dxc:XYDiagram2D.Series>
            </dxc:XYDiagram2D>
        </dxc:ChartControl.Diagram>
</dxc:ChartControl>
This code utilizes the following classes and properties:
Member | Description |
|---|---|
Specifies the series’s data source. | |
Gets or sets the name of the data field which contains arguments for generated series points. | |
Gets or sets the name of the data field which contains values for generated series points. |
To populate series with points from a data source, the chart control generates a series point for each data item. Then, series points use the argument data member’s values as Argument values and the value data member’s values as Value values.
Note that several series require more than one ValueDataMember specified to display data. The following table lists series that have specific ValueDataMember parameters:
Series | Parameters |
|---|---|
FinancialSeries2D.OpenValueDataMember FinancialSeries2D.HighValueDataMember | |
Important
The Series.Points property returns series points that represent data source values on a chart. The first time you access this property, the series generates series points when the chart/series is bound to data. It is recommended that you avoid using this property, because series point generation requires additional time to convert internal data objects to series points, which in turn can lead to control freezes.
Refer to the Lesson 3 - Bind Chart Series to Data topic for a step-by-step guide that explains how to create a chart, and bind it to a data source.
MVVM Binding
Use the Diagram.SeriesItemsSource property to bind a chart to a collection of series view models when your application uses the MVVM (Model-View-ViewModel) architecture. The Diagram.SeriesItemTemplate and Diagram.SeriesItemTemplateSelector properties specify how the chart converts view model objects to series.
The following code uses the MVVM architecture to populate the Chart Control with series:
<dxc:ChartControl>
    <dxc:ChartControl.Legends>
        <dxc:Legend HorizontalPosition="Left" VerticalPosition="Top" Orientation="Horizontal"/>
    </dxc:ChartControl.Legends>
    <dxc:XYDiagram2D SeriesItemsSource="{Binding GdpSeries}">
        <dxc:XYDiagram2D.SeriesItemTemplate>
            <DataTemplate>
                <dxc:LineSeries2D DisplayName="{Binding CountryName}"
                                  DataSource="{Binding Values}"
                                  ArgumentDataMember="Year"
                                  ValueDataMember="Value"/>
            </DataTemplate>
        </dxc:XYDiagram2D.SeriesItemTemplate>
    </dxc:XYDiagram2D>
</dxc:ChartControl>
The code above utilizes the properties below:
Member | Description |
|---|---|
Gets or sets the collection of objects used to generate series. | |
Gets or sets the DataTemplate that specifies how to convert a model object to a series. | |
Gets or sets the custom logic for selecting a data template that converts a model object to a series. |
Series Types
The Chart Control provides 2D and 3D series. The following sections list all available series:
Note that series of each type have unique specifics and settings. The control can only simultaneously display different types of series if they are compatible.
Series Elements
Element | Image |
|---|---|
|
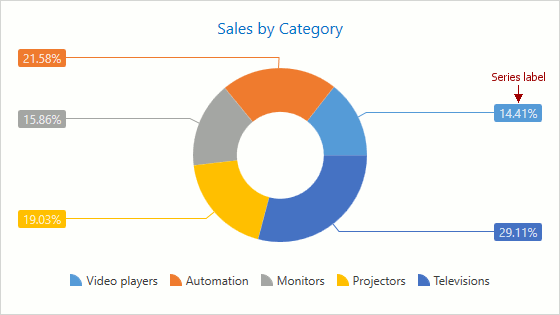
You can show points with labels to provide extra information, such as point arguments or values. |
|
|
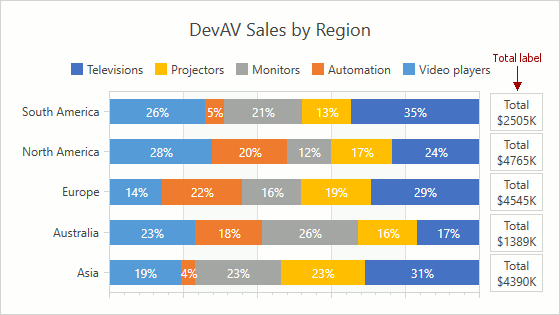
Total labels display summary values of several Bar Stacked or Pie series’ points. |
|
|
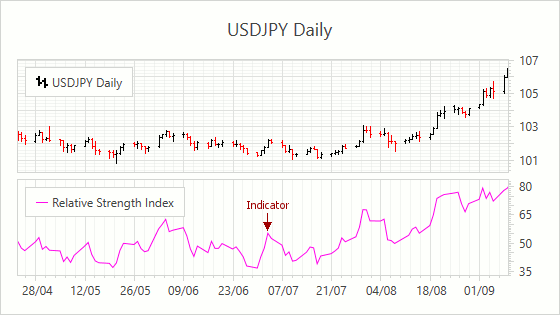
Indicators help you to analyze and process series data visually. |
|
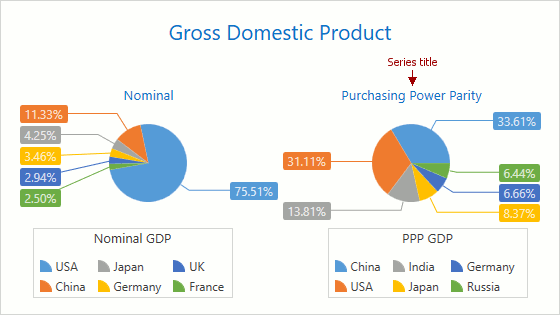
|
A series title provides additional information on a series. |
|
Colorize Series
The XYSeries.Brush property allows you to specify series color. The Area Series and Funnel Series provide the Border properties that contain the Brush property. This property specifies the series’ border brush:
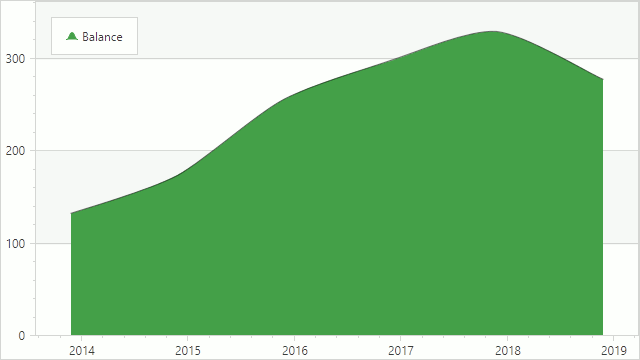
The following markup demonstrates how to specify a custom color for a series:
<dxc:ChartControl Padding="0">
    <dxc:ChartControl.DataContext>
        <local:MainViewModel/>
    </dxc:ChartControl.DataContext>
    <dxc:ChartControl.Diagram>
        <dxc:XYDiagram2D>
            <dxc:XYDiagram2D.Series>
                <dxc:SplineAreaSeries2D DataSource="{Binding History}"
                                        ArgumentDataMember="Date"
                                        ValueDataMember="Balance"
                                        Brush="#43a047">
                    <dxc:SplineAreaSeries2D.Border>
                        <dxc:SeriesBorder Brush="#88000000"/>
                    </dxc:SplineAreaSeries2D.Border>
                </dxc:SplineAreaSeries2D>
            </dxc:XYDiagram2D.Series>
        </dxc:XYDiagram2D>
    </dxc:ChartControl.Diagram>
</dxc:ChartControl>
The classes and properties below configure series’ colors:
Symbol | Description |
|---|---|
Gets or sets the color of the XY-series. | |
Provides access to a series border’s settings. | |
Contains settings the specify the appearance of a series border. |
Important
The Chart Control can use only SolidColorBrush objects to draw series.
Note
The pie/donut series and funnel series do not provide series color and you should utilize series points’ brushes
Tip
Use the ChartControl.BoundDataChanged event to specify colors of series generated via the Series Template.