Chart Elements
- 2 minutes to read
The DevExpress WPF Chart control consists of elements which define the chart’s appearance and behavior.
This topic lists all these elements and provides detailed information about them.
Note
The Chart Control can hide its elements if there is insufficient space to display them. Elements are hidden in the following order:
To make the Chart Control always display its elements, disable the ChartControl.AutoLayout property.
The diagram is the main chart’s element, and its type determines which series views and additional elements you can add to a chart. It also determines the chart’s appearance and features. The Chart control provides the following diagram types:
- 2D XY (Cartesian) Diagram
- Simple 2D Diagram
- Radar and Polar Diagrams
- 3D XY Diagram
- Simple 3D Diagram
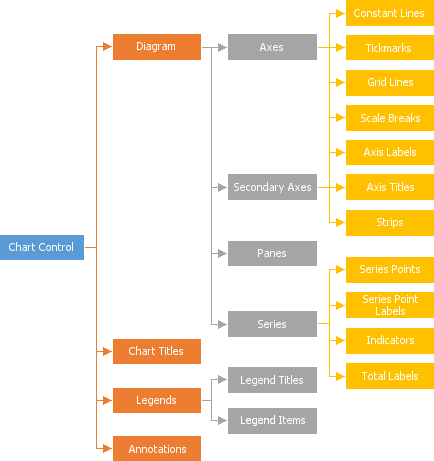
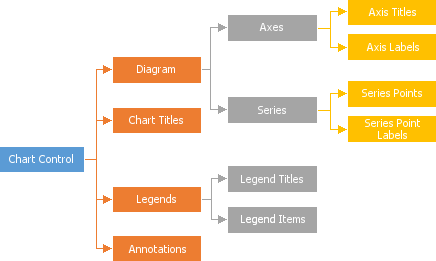
2D XY (Cartesian) Diagram
The following figure represents the XY Diagram structure:
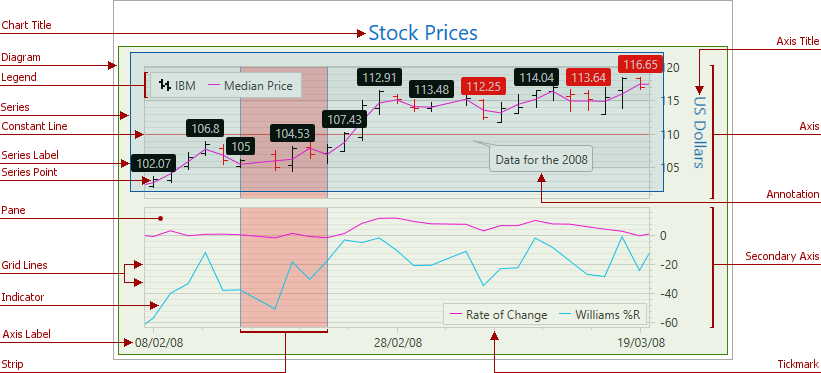
The image below demonstrates the XY Diagram’s chart items.
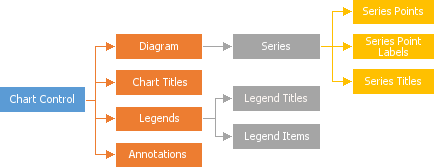
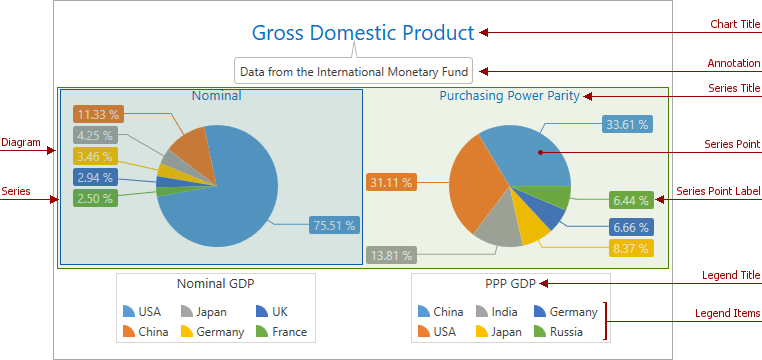
Simple 2D Diagram
The following figure shows the hierarchy of chart elements you can add to a Simple Diagram:
The Simple Diagram elements are demonstrated in the image below.
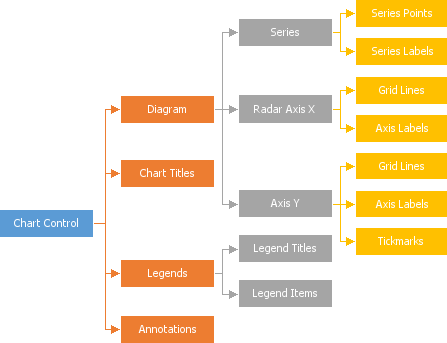
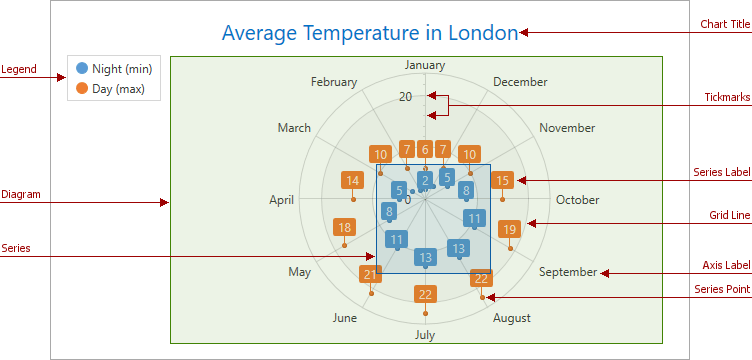
Radar and Polar Diagrams
The following figure illustrates the hierarchy of Radar Diagram‘s and Polar Diagram‘s chart elements.
The following image demonstrates these chart items:
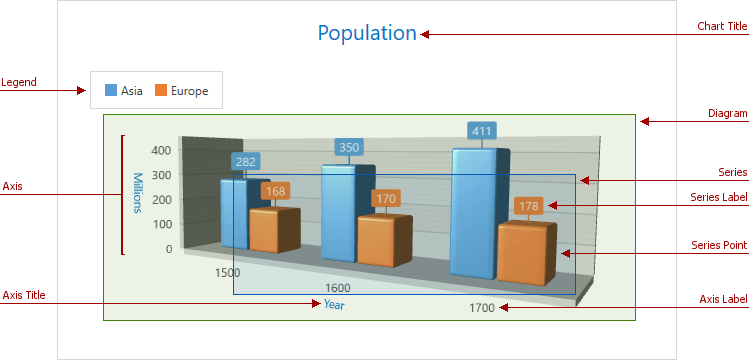
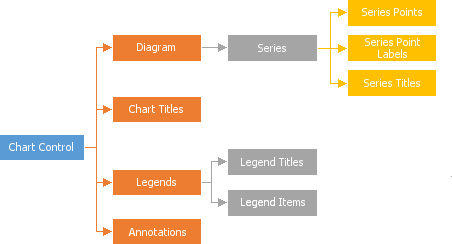
3D XY Diagram
The following image shows the 3D XY Diagram‘s structure:
The image below demonstrates the 3D XY Diagram’s elements.
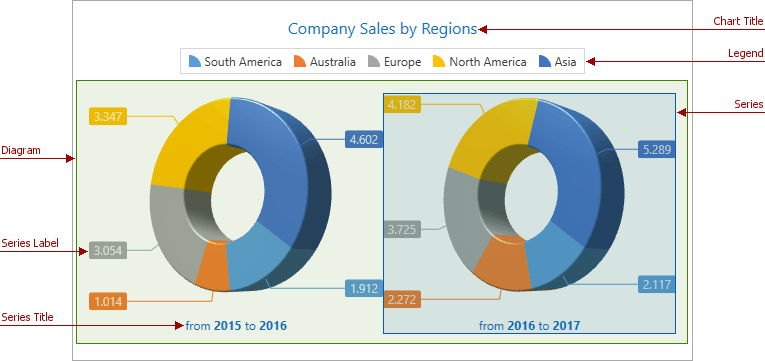
Simple 3D Diagram
The following figure illustrates all the possible 3D XY Diagram elements:
The image below shows a simple 3D Diagram with its elements.