Total Summary
- 3 minutes to read
Total Summary Overview
A total summary represents a value of an aggregate function calculated over all data rows displayed within a View. Total summaries are displayed within the Summary Panel or Fixed Summary Panel, provided that the DataViewBase.ShowTotalSummary and DataViewBase.ShowFixedTotalSummary options are enabled, respectively. Summaries displayed within the Fixed Summary Panel are not horizontally scrolled, they are always visible onscreen, regardless of the corresponding column’s position and visibility.
Table Views and TreeList Views display Summary panels at the bottom.

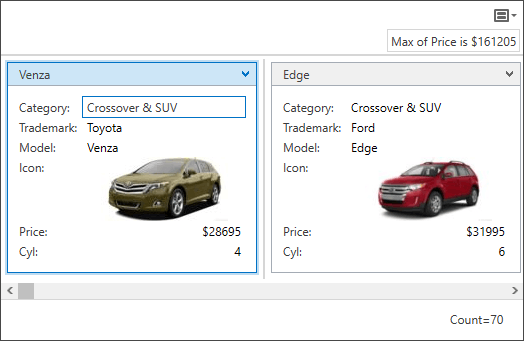
In Card Views, the Summary Panel is displayed at the top, and the Fixed Summary Panel is displayed at the bottom.
Displaying Total Summaries
Total summaries are represented by the GridSummaryItem objects. The grid stores its total summaries within the GridControl.TotalSummary collection.
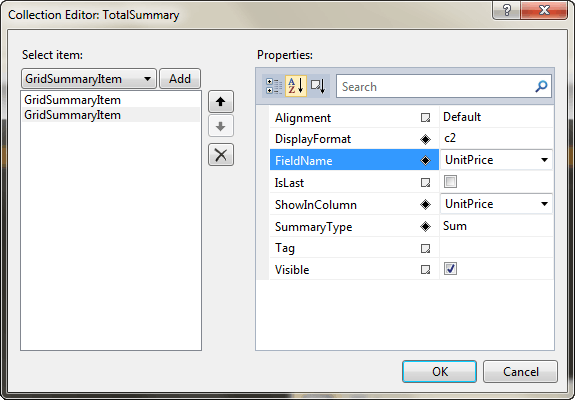
To create a total summary item at design time, use the TotalSummary Collection Editor.
By default, total summary items are displayed within the Summary Panel. To display a total summary item within the Fixed Summary Panel, align it to the Left or Right using the SummaryItemBase.Alignment property. If this property is set to ‘Default’, a summary item is displayed within the Summary Panel.
<dxg:GridControl.TotalSummary>
    <dxg:GridSummaryItem SummaryType="Count" Alignment="Right" />
    <dxg:GridSummaryItem FieldName="UnitPrice" SummaryType="Sum" DisplayFormat="{}{0:c2}" />
</dxg:GridControl.TotalSummary>
To create a total summary in code, create a new instance of the GridSummaryItem class, specify its SummaryItemBase.FieldName and SummaryItemBase.SummaryType properties and add it to the GridControl.TotalSummary collection. To display a summary item within the Fixed Summary Panel, align it to the Left or Right using the SummaryItemBase.Alignment property.
using DevExpress.Xpf.Data;
using DevExpress.Data;

// ...
grid.TotalSummary.AddRange(new List<GridSummaryItem>() {
    new GridSummaryItem() {
        SummaryType = SummaryItemType.Count,
        FieldName = "ProductName"
    },
    new GridSummaryItem() {
        SummaryType = SummaryItemType.Max,
        FieldName = "UnitPrice",
        DisplayFormat = "Max: {0:c2}"
    },
    new GridSummaryItem() {
        SummaryType = SummaryItemType.Average,
        FieldName = "UnitPrice",
        DisplayFormat = "Avg: {0:c2}"
    },
});
Use the AddRange method to add a range of summary items to the collection.
End users can display total summaries using the Summary Panel’s popup menu. You can enable or disable the total summary popup menu using the DataViewBase.IsTotalSummaryMenuEnabled property. To learn more, see Customizing Summaries and Runtime Summary Editor.
Note
In Master-Detail mode, total summary rows are only visible when you scroll to the bottom of the detail. You cannot make them always visible regardless of the vertical scrolling position. To learn more, see Master-Detail Mode Limitations.
Tip
Example: How to: Display Total Summaries
Obtaining Summary Values
To obtain a total summary value, use the DataControlBase.GetTotalSummaryValue method. To obtain a list of total summary items displayed within a column, use the column’s ColumnBase.TotalSummaries property.
To determine whether a column displays a total summary(s), use the ColumnBase.HasTotalSummaries property.
Use the DataViewBase.FixedSummariesLeft and DataViewBase.FixedSummariesRight properties to obtain total summaries displayed within the Fixed Summary Panel and aligned to the Left or Right, respectively.
Server Mode Limitations
In a Server Mode, total summaries cannot be calculated for unbound columns whose values are calculated via events. Only columns with the specified unbound expressions support total summaries.