Pie and Donut
Short Description
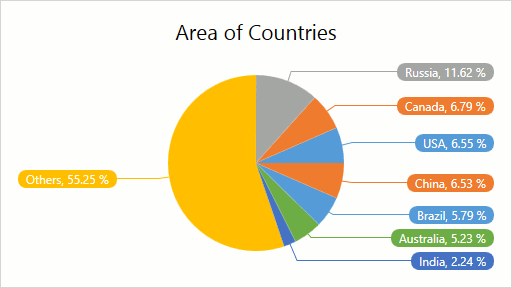
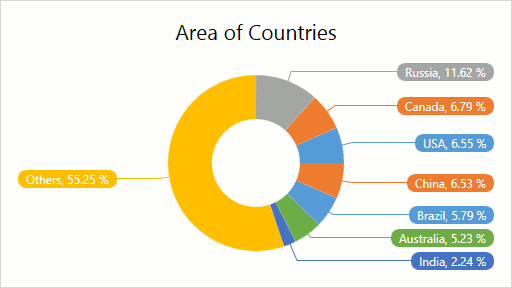
The Pie series is useful when it’s necessary to compare the percentage values of different point arguments in the same series, and to illustrate these values as easy to understand pie slices. The Donut series is similar to Pie, but has a hole in its center.
An example of the Pie and Donut charts is shown in the image below.
Series Characteristics
The table below lists the main characteristics of this chart type.
| Feature | Value |
|---|---|
| Series View type | PieSeries2D |
| Diagram type | SimpleDiagram2D |
| Number of arguments per series point | 1 |
| Number of values per series point | 1 |
For information on which series view types can be combined with the Pie and Donut view, refer to the Series Type Compatibility document.
Example
The following example demonstrates how to create a 2D Pie and Donut chart.