Full-Stacked Area
Short Description
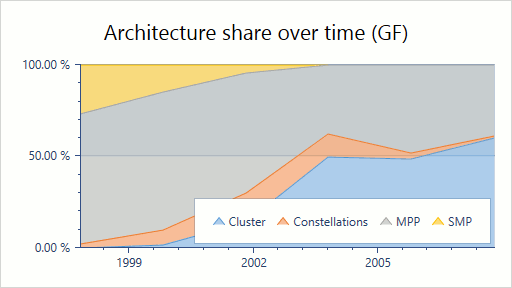
The Full-Stacked Area series (100% Stacked Area series) displays data as areas on a diagram, so that the value of each data point is stacked with all the other corresponding data points’ values. In this instance, the height of the area is always the full height of the chart diagram (i.e. 1). This representation is useful for comparing the percentage values of several series for the same point arguments.
An example of the Full-Stacked Area chart is shown in the image below.
Series Characteristics
The table below lists the main characteristics of this chart type.
| Feature | Value |
|---|---|
| Series View type | AreaFullStackedSeries2D |
| Diagram type | XYDiagram2D |
| Number of arguments per series point | 1 |
| Number of values per series point | 1 |
For information on which series view types can be combined with the Full-Stacked Area view, refer to the Series Type Compatibility document.
Example
The following example demonstrates how to create a 2D Full-Stacked Area chart.