Area
Short Description
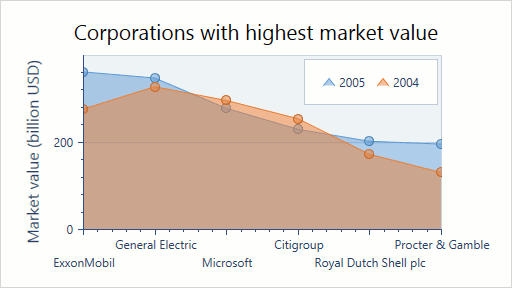
The Area series displays data as filled areas on a diagram, with each data point displayed as a peak or hollow in the area. This representation is useful when you need to show trends for several series on the same diagram, and also show the relationship of the parts to the whole.
An example of the Area chart is shown in the image below.
Series Characteristics
The table below lists the main characteristics of this chart type.
| Feature | Value |
|---|---|
| Series View type | AreaSeries2D |
| Diagram type | XYDiagram2D |
| Number of arguments per series point | 1 |
| Number of values per series point | 1 |
For information on which series view types can be combined with the Area view, refer to the Series Type Compatibility document.
Example
The following example demonstrates how to create a 2D Area chart.