Empty Points
- 6 minutes to read
This topic explains what Empty Points are, how the Chart Control processes empty points, and how to add such a point to a chart.
Empty points are points with undefined values. You can use empty points to insert gaps between series point values. The Chart displays empty points as breaks in continuous series (for example, Line or Area), and missing points or bars in discrete series (for example, Bars or Points). Empty points in the Pie, Donut, and Funnel series are skipped.
](/WPF/images/chart-control/empty-points-line-series.png?v=20.1)
](/WPF/images/chart-control/empty-points-spline-area-series.png?v=20.1)
](/WPF/images/chart-control/empty-points-bar-series.png?v=20.1)
](/WPF/images/chart-control/empty-points-point-series.png?v=20.1)
The following table contains data for the charts above:
| Date | Politics | Entertainment | Travel |
|---|---|---|---|
| 01-Jan-19 | 65 | 56 | 45 |
| 02-Jan-19 | 78 | 45 | 40 |
| 03-Jan-19 | 95 | 70 | 56 |
| 04-Jan-19 | 110 | 82 | 47 |
| 05-Jan-19 | 108 | 80 | 38 |
| 06-Jan-19 | 52 | 20 | 31 |
| 07-Jan-19 | 46 | 10 | 27 |
| 08-Jan-19 | 70 | 27 | |
| 09-Jan-19 | 86 | 42 | |
| 10-Jan-19 | 92 | 65 | |
| 11-Jan-19 | 108 | 45 | 37 |
| 12-Jan-19 | 115 | 56 | 21 |
| 13-Jan-19 | 75 | 10 | 10 |
| 14-Jan-19 | 65 | 0 | 5 |
Note
20.1 Demo Center: Launch the Empty Points demo
To make a point empty, do one of the following:
set a point’s value to NaN if you use the Chart Designer to add points to a series.
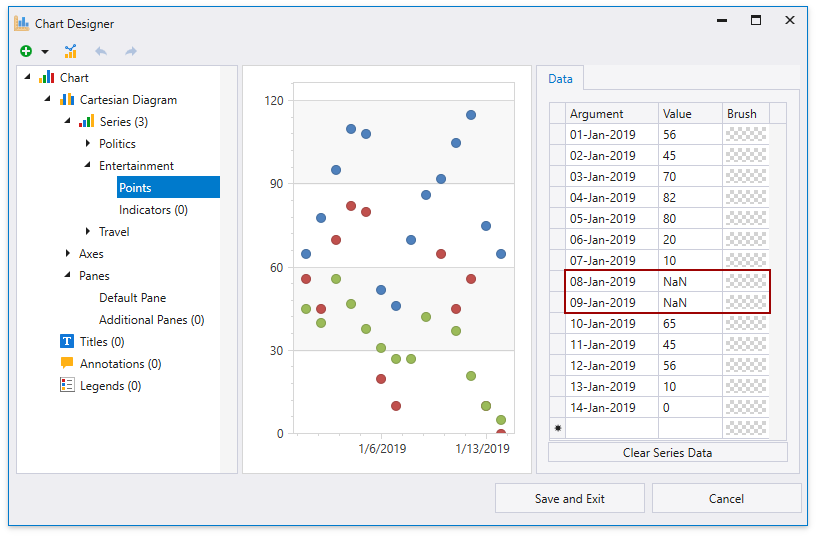
leave a value undefined if you add points in markup.
<dxc:ChartControl>
    <dxc:XYDiagram2D>
        <dxc:PointSeries2D DisplayName="Travel">
            <!-- ... -->
            <dxc:SeriesPoint Argument="2016/11/9" Value="42"/>
            <dxc:SeriesPoint Argument="2016/11/10"/> <!-- This is an empty point. -->
            <dxc:SeriesPoint Argument="2016/11/11" Value="37"/>
            <!-- ... -->
        </dxc:PointSeries2D>
    </dxc:XYDiagram2D>
</dxc:ChartControl>
use the SeriesPoint‘s class constructors that take only an argument as a parameter if you add points to a series in code.
or set a data point’s numeric value to Double.NaN(or Single.NaN) in a data source. If a series point has a date-time value, use the DateTime.MinValue value. Use TimeSpan.Zero for the time-span series point values.
Markup:
<dxc:ChartControl x:Name="chartControl" DataSource="{Binding Data}">
    <dxc:ChartControl.DataContext>
        <local:ChartViewModel/>
    </dxc:ChartControl.DataContext>
    <dxc:XYDiagram2D>
        <dxc:PointSeries2D ArgumentDataMember="Date" ValueDataMember="Politics"      DisplayName="Politics"/>
        <dxc:PointSeries2D ArgumentDataMember="Date" ValueDataMember="Entertainment" DisplayName="Entertainment"/>
        <dxc:PointSeries2D ArgumentDataMember="Date" ValueDataMember="Travel"        DisplayName="Travel"/>
    </dxc:XYDiagram2D>
</dxc:ChartControl>
Code-Behind:
public class ChartViewModel {
    public List<DataPoint> Data { get { return GetPoints(); } }
    public static List<DataPoint> GetPoints() {
        return new List<DataPoint> {
                new DataPoint { Date = new DateTime(2019,1,1), Politics = 65,   Entertainment = 56, Travel = 45 },
                new DataPoint { Date = new DateTime(2019,1,2), Politics = 78,   Entertainment = 45, Travel = 40 },
                new DataPoint { Date = new DateTime(2019,1,3), Politics = 95,   Entertainment = 70, Travel = 56 },
                new DataPoint { Date = new DateTime(2019,1,4), Politics = 110,  Entertainment = 82, Travel = 47 },
                new DataPoint { Date = new DateTime(2019,1,5), Politics = 108,  Entertainment = 80, Travel = 38 },
                new DataPoint { Date = new DateTime(2019,1,6), Politics = 52,   Entertainment = 20, Travel = 31 },
                new DataPoint { Date = new DateTime(2019,1,7), Politics = 46,   Entertainment = 10, Travel = 27 },
                new DataPoint { Date = new DateTime(2019,1,8), Politics = 70,   Entertainment = double.NaN, Travel = 27 },
                new DataPoint { Date = new DateTime(2019,1,9), Politics = 86,   Entertainment = double.NaN, Travel = 42 },
                new DataPoint { Date = new DateTime(2019,1,10), Politics = 92,  Entertainment = 65, Travel = double.NaN},
                new DataPoint { Date = new DateTime(2019,1,11), Politics = 105, Entertainment = 45, Travel = 37 },
                new DataPoint { Date = new DateTime(2019,1,12), Politics = 115, Entertainment = 56, Travel = 21 },
                new DataPoint { Date = new DateTime(2019,1,13), Politics = 75,  Entertainment = 10, Travel = 10 },
                new DataPoint { Date = new DateTime(2019,1,14), Politics = 65,  Entertainment = 0 , Travel = 5  }
            };
    }
}
public class DataPoint {
    public DateTime Date { get; set; }
    public double Politics { get; set; }
    public double Entertainment { get; set; }
    public double Travel { get; set; }
}
Missing points (points that do not exist for particular axis arguments) are represented as empty points if the ProcessMissingPoints (NumericAggregationScaleOptionsBase.ProcessMissingPoints, DateTimeAggregationScaleOptionsBase.ProcessMissingPoints or TimeSpanAggregationScaleOptionsBase.ProcessMissingPoints) property is set to InsertEmptyPoints.
Tip
- You can use scale breaks to hide specific data ranges from an axis.
- To limit data displayed in a chart, configure visual and whole axis ranges.
- If you use an argument axis with a date-time scale, you can exclude holidays, weekends or particular hours from a scale. Refer to Work Time and Workday Configuration for more information.
Show Isolated Points
The Chart does not draw a point between two empty points. To display a point in this case, enable the ShowIsolatedPoints (LineSeries2D.ShowIsolatedPoints or CircularLineSeries2D.ShowIsolatedPoints) property.
| ShowIsolatedPoints = true | ShowIsolatedPoints = false |
|---|---|
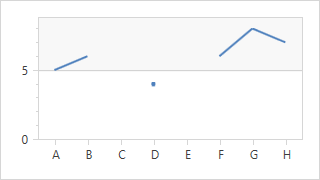 |
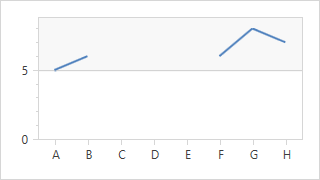 |
<dxc:ChartControl>
    <dxc:XYDiagram2D>
        <dxc:LineSeries2D ShowIsolatedPoints="True">
            <dxc:SeriesPoint Argument="A" Value="5"/>
            <dxc:SeriesPoint Argument="B" Value="6"/>
            <dxc:SeriesPoint Argument="C" />
            <dxc:SeriesPoint Argument="D" Value="4"/> <!-- This point is isolated. -->
            <dxc:SeriesPoint Argument="E" />
            <dxc:SeriesPoint Argument="F" Value="6"/>
            <dxc:SeriesPoint Argument="G" Value="8"/>
            <dxc:SeriesPoint Argument="H" Value="7"/>
        </dxc:LineSeries2D>
    </dxc:XYDiagram2D>
</dxc:ChartControl>