Box Plot Series
- 5 minutes to read
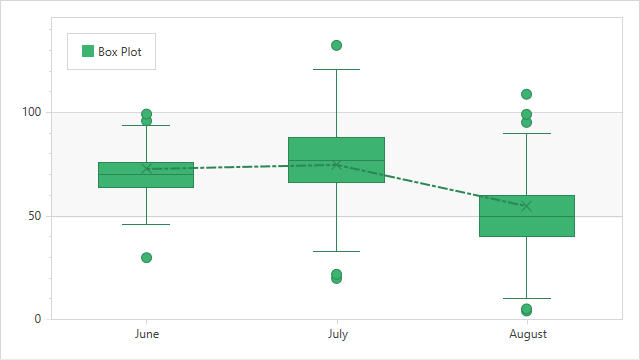
The Box Plot (also called Box-and-Whisker Plot) chart is used to analyze statistic-driven data points. To draw a Box Plot point, pass the Min, Quartile1, Median, Quartile3, and Max parameters. You can also display a set of Outliers and a Mean value (optional).
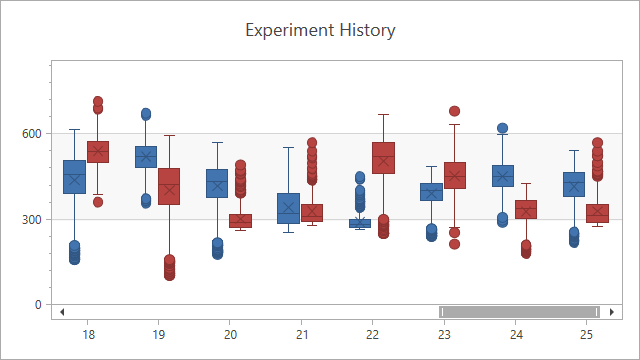
Chart Type Characteristics
The table below lists the main box plot chart characteristics:
| Feature | Value |
|---|---|
| Series view type | BoxPlotSeries2D |
| Diagram type | XYDiagram2D |
| Number of arguments per series point | 1 |
| Number of values per series point | 6 values and an array of outliers |
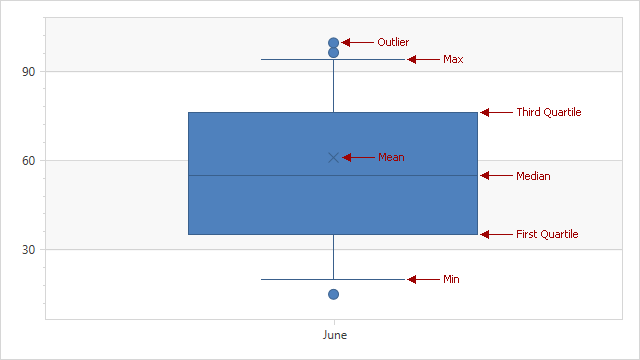
The following image shows the Box Plot chart elements:
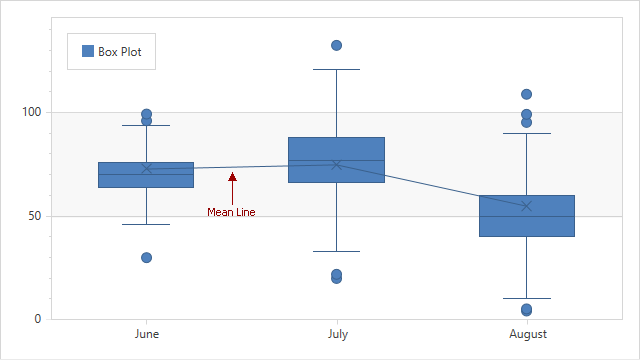
You can also display the series Mean line. Set the BoxPlotSeries2D.MeanLineVisible property to true for this:
Limitations
- The Box Plot series view does not support series labels.
- Box plot points cannot be aggregated.
Create a Box Plot Chart
The following example creates a Box Plot chart with three points:
- Add a chart to a WPF project.
- Add an XYDiagram2D object to the chart.
- Add a BoxPlotSeries2D object to the diagram. Specify the series data source.
Use the following properties to specify data members for the series:
- Series.ArgumentDataMember
- BoxPlotSeries2D.MinValueDataMember
- BoxPlotSeries2D.MaxValueDataMember
- BoxPlotSeries2D.Quartile1ValueDataMember
- BoxPlotSeries2D.Quartile3ValueDataMember
- BoxPlotSeries2D.MedianValueDataMember
- BoxPlotSeries2D.MeanValueDataMember (Optional parameter)
- BoxPlotSeries2D.OutlierValuesDataMember (Optional parameter)
Markup:
<Window
        xmlns="http://schemas.microsoft.com/winfx/2006/xaml/presentation"
        xmlns:x="http://schemas.microsoft.com/winfx/2006/xaml"
        xmlns:d="http://schemas.microsoft.com/expression/blend/2008"
        xmlns:mc="http://schemas.openxmlformats.org/markup-compatibility/2006"
        xmlns:local="clr-namespace:BoxPlotChart"
        xmlns:dxc="http://schemas.devexpress.com/winfx/2008/xaml/charts"
        x:Class="BoxPlotChart.MainWindow"
        mc:Ignorable="d"
        Title="MainWindow" Height="600" Width="800">
    <Window.DataContext>
        <local:ChartViewModel/>
    </Window.DataContext>
    <Grid>
        <dxc:ChartControl>
            <dxc:ChartControl.Legends>
                <dxc:Legend HorizontalPosition="Left"/>
            </dxc:ChartControl.Legends>
            <dxc:XYDiagram2D>
                <dxc:BoxPlotSeries2D DataSource="{Binding Data}"
                                     DisplayName="Box Plot"
                                     ArgumentDataMember="Argument"
                                     MinValueDataMember="Min"
                                     MaxValueDataMember="Max"
                                     Quartile1ValueDataMember="Quartile1"
                                     Quartile3ValueDataMember="Quartile3"
                                     MedianValueDataMember="Median"
                                     MeanValueDataMember="Mean"
                                     OutlierValuesDataMember="Outliers"
                                     MeanLineVisible="True">
                    <dxc:BoxPlotSeries2D.Model>
                        <dxc:SimpleBoxPlot2DModel/>
                    </dxc:BoxPlotSeries2D.Model>
                </dxc:BoxPlotSeries2D>
                <dxc:XYDiagram2D.AxisX>
                    <dxc:AxisX2D TickmarksMinorVisible="False"/>
                </dxc:XYDiagram2D.AxisX>
            </dxc:XYDiagram2D>
        </dxc:ChartControl>
    </Grid>
</Window>
Code-Behind:
using System.Collections.ObjectModel;
using System.Windows;
namespace BoxPlotChart {
    public partial class MainWindow : Window {
        public MainWindow() {
            InitializeComponent();
        }
    }
    public class ChartViewModel {
        public Collection<DataPoint> Data { get { return DataPoint.GetDataPoints(); } }
        public class DataPoint {
            public string Argument { get; set; }
            public double Min { get; set; }
            public double Max { get; set; }
            public double Quartile1 { get; set; }
            public double Quartile3 { get; set; }
            public double Median { get; set; }
            public double Mean { get; set; }
            public double[] Outliers { get; set; }
            public DataPoint(string argument, double min, double max, double q1, double q3, double median, double mean, double[] outliers) {
                this.Argument = argument;
                this.Min = min;
                this.Max = max;
                this.Quartile1 = q1;
                this.Quartile3 = q3;
                this.Median = median;
                this.Mean = mean;
                this.Outliers = outliers;
            }
            public static Collection<DataPoint> GetDataPoints() {
                Collection<DataPoint> data = new Collection<DataPoint> {
                    new DataPoint("June", 46, 94, 64, 76, 70, 73, new double[]{ 30, 96.3, 99.56 }),
                    new DataPoint("July", 33, 121, 66, 88, 77, 75, new double[]{ 20, 22, 132.7 }),
                    new DataPoint("August", 10, 90, 40, 60, 50, 55, new double[]{ 4, 5, 95.4, 99.3, 109 })
                };
                return data;
            }
        }
    }
}
Format the Crosshair Label
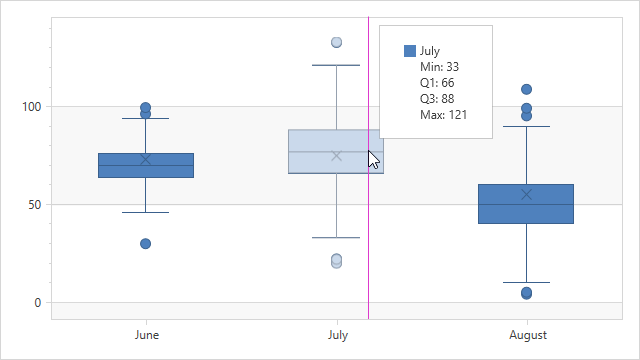
Use the XYSeries2D.CrosshairLabelPattern property to format the crosshair label text.
The Chart Control provides the following placeholders that you can use in patterns:
| Placeholder | Description |
|---|---|
| {BP_MIN} | Displays the Box Plot point’s Minimum value. |
| {BP_Q1} | Displays the Box Plot point’s First Quartile value. |
| {BP_MDN} | Displays the Box Plot point’s Median value. |
| {BP_AVG} | Displays the Box Plot point’s Mean value. |
| {BP_Q3} | Displays the Box Plot point’s Third Quartile value. |
| {BP_MAX} | Displays the Box Plot point’s Maximum value. |
<dxc:BoxPlotSeries2D CrosshairLabelPattern="{}{A}
Min: {BP_MIN}
Q1: {BP_Q1}
Q3: {BP_Q3}
Max: {BP_MAX}"/>
You can use format specifiers to format the placeholders’ values. For example, the “{BP_Q1:f1}” pattern displays the First Quartile value with one digit after the comma.
Change Chart Appearance
This section explains how to modify the Box Plot chart’s appearance.
The BoxPlotSeries2D class exposes the following appearance settings for the Box Plot chart:
- BoxPlotSeries2D.CapWidthPercentage - Gets or sets the cap width of a Box Plot series point as percentage.
- BoxPlotSeries2D.BoxWidth - Gets or sets the Box Plot’s point width measured in axis units.
- XYSeries.Brush - Gets or sets the color of the XY-series.
- BoxPlotSeries2D.MeanLineStyle - Specifies Mean line style settings. See the following help topic for more information about line style settings: LineStyle.
<dxc:BoxPlotSeries2D MeanLineVisible="True"
                     CapWidthPercentage="50"
                     BoxWidth="0.5"
                     Brush="MediumSeaGreen">
    <dxc:BoxPlotSeries2D.MeanLineStyle>
        <dxc:LineStyle Thickness="2" DashCap="Flat">
            <dxc:LineStyle.DashStyle>
                <DashStyle Dashes="2 1 5 1"/>
            </dxc:LineStyle.DashStyle>
        </dxc:LineStyle>
    </dxc:BoxPlotSeries2D.MeanLineStyle>
</dxc:BoxPlotSeries2D>