Waterfall
- 8 minutes to read
A Waterfall chart (also called Bridge Chart, Cascade Chart or Flying Bricks Chart) displays a sequence of bars that indicate positive or negative changes. You can plot Waterfall charts based on relative or absolute data values, and add two types of summary bars: the Total bar next to series points summarizes all values, and the Subtotals bar between two adjacent points (bars) that displays intermediate values.
Demo: Waterfall
Chart Type Characteristics
The table below lists the main waterfall chart characteristics:
| Feature | Value |
|---|---|
| Series view type | WaterfallSeries2D |
| Diagram type | XYDiagram2D |
| Number of arguments per series point | 1 |
| Number of values per series point | 1 |
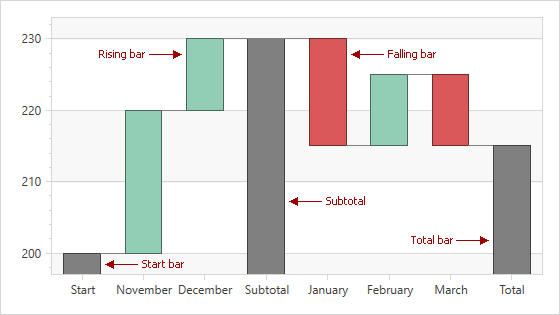
The following image shows the waterfall chart elements:
Create a Waterfall Chart
The following example demonstrates how to create a chart with a Waterfall series:
- Add a chart to a WPF project.
- Add a XYDiagram2D object to the chart.
- Add a WaterfallSeries2D object to the diagram. Specify the series’s data source.
- Specify data members for the series.
Markup:
<Window
        xmlns="http://schemas.microsoft.com/winfx/2006/xaml/presentation"
        xmlns:x="http://schemas.microsoft.com/winfx/2006/xaml"
        xmlns:d="http://schemas.microsoft.com/expression/blend/2008"
        xmlns:mc="http://schemas.openxmlformats.org/markup-compatibility/2006"
        xmlns:local="clr-namespace:WatefallChart"
        xmlns:dxc="http://schemas.devexpress.com/winfx/2008/xaml/charts"
        x:Class="WatefallChart.MainWindow"
        mc:Ignorable="d"
        Title="MainWindow" Height="600" Width="800">
    <Grid>
        <dxc:ChartControl>
            <dxc:XYDiagram2D>
                <dxc:WaterfallSeries2D DisplayName="Waterfall"
                                       DataSource="{Binding}"
                                       ArgumentDataMember="Argument"
                                       ValueDataMember="Value"
                                       CrosshairLabelPattern="{}{V}"
                                       RisingBarBrush="#FF92CEB5"
                                       FallingBarBrush="#FFDA5859">
                </dxc:WaterfallSeries2D>
            </dxc:XYDiagram2D>
        </dxc:ChartControl>
    </Grid>
</Window>
Code-Behind:
using System.Collections.Generic;
using System.Windows;

namespace WatefallChart {
    public partial class MainWindow : Window {
        public MainWindow() {
            InitializeComponent();
            this.DataContext = DataLoader.GetDataPoints();
        }
    }
    class DataLoader {
        public static List<DataPoint> GetDataPoints() {
            List<DataPoint> list = new List<DataPoint> {
                new DataPoint("November", 20),
                new DataPoint("December", 10),
                new DataPoint("January", -15),
                new DataPoint("February", 10),
                new DataPoint("March", -10)
            };
            return list;
        }
    }
    public class DataPoint {
        public string Argument { get; private set; }
        public double Value { get; private set; }
        public DataPoint(string arg, double val) {
            Argument = arg;
            Value = val;
        }
    }
}
Refer to Providing Data for more information about how to populate a chart with data.
Process Relative and Absolute Data Values
If the WaterfallSeries2D.ValueOptions property is set to a WaterfallRelativeValueOptions object, the control processes data source values as increments/decrements. You can create and assign a WaterfallAbsoluteValueOptions object to handle data as absolute values.
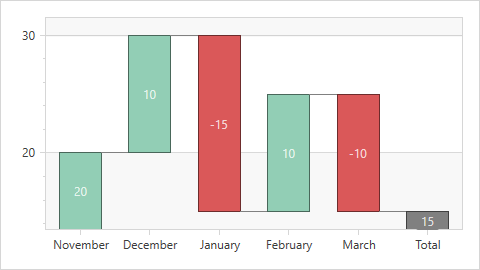
The following charts visualize the same data with different value options:
| Relative Value Options (default) | Absolute Value Options |
|---|---|
 |
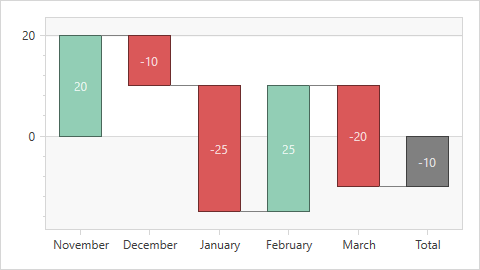 |
The following table demonstrates data source values:
| Argument | Value |
|---|---|
| November | 20 |
| December | 10 |
| January | -15 |
| February | 10 |
| March | -10 |
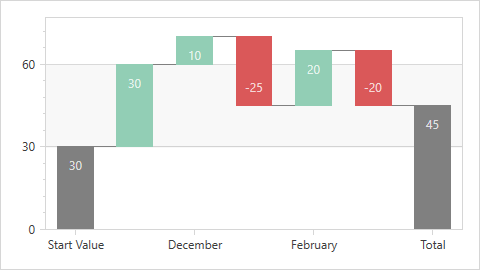
Plot a Waterfall Based on Relative Values
Set the WaterfallSeries2D.ValueOptions property to a WaterfallRelativeValueOptions object if the chart’s data source stores increments/decrements. You can also display a start bar with the initial value. The chart plots a start bar at zero if the start bar value is not specified.
<dxc:ChartControl>
    <dxc:XYDiagram2D>
        <dxc:WaterfallSeries2D.ValueOptions>
            <dxc:WaterfallRelativeValueOptions StartBarLabel="Start"
                                               StartBarValue="50">
            </dxc:WaterfallRelativeValueOptions>
        </dxc:WaterfallSeries2D.ValueOptions>
        <dxc:WaterfallSeries2D DisplayName="Waterfall"
                               DataSource="{Binding}"
                               ArgumentDataMember="Argument"
                               ValueDataMember="Value"
                               CrosshairLabelPattern="{}{V}"
                               RisingBarBrush="#FF92CEB5"
                               FallingBarBrush="#FFDA5859"
                               LabelsVisibility="True">
        </dxc:WaterfallSeries2D>
    </dxc:XYDiagram2D>
</dxc:ChartControl>
Related API members
- WaterfallSeries2D.ValueOptions - Gets or sets settings specific to the relative or absolute data source values.
- WaterfallRelativeValueOptions - Stores settings for a waterfall chart that is plotted based on relative data source values.
- WaterfallRelativeValueOptions.StartBarValue - Gets or sets the start bar value.
- WaterfallRelativeValueOptions.StartBarLabel - Gets or sets the start bar label.
Plot a Waterfall Based on Absolute Values
Set the WaterfallSeries2D.ValueOptions property to a WaterfallAbsoluteValueOptions object if the chart’s data source stores a set of absolute values. In this case, the chart automatically calculates differences and plot them as waterfall bars.
<dxc:ChartControl>
    <dxc:XYDiagram2D>
        <dxc:WaterfallSeries2D.ValueOptions>
            <dxc:WaterfallAbsoluteValueOptions/>
        </dxc:WaterfallSeries2D.ValueOptions>
        <dxc:WaterfallSeries2D DisplayName="Waterfall"
                               DataSource="{Binding}"
                               ArgumentDataMember="Argument"
                               ValueDataMember="Value"
                               CrosshairLabelPattern="{}{V}"
                               RisingBarBrush="#FF92CEB5"
                               FallingBarBrush="#FFDA5859"
                               LabelsVisibility="True">
        </dxc:WaterfallSeries2D>
    </dxc:XYDiagram2D>
</dxc:ChartControl>
Related API members
- WaterfallSeries2D.ValueOptions - Gets or sets settings specific to the relative or absolute data source values.
- WaterfallAbsoluteValueOptions - Stores settings for a waterfall chart that is plotted based on absolute data source values.
Add Total and Subtotals
The Waterfall Chart can display a total bar and multiple subtotals.
Note
You can only show the total bar and add subtotals to a series with qualitative arguments.
<dxc:ChartControl>
    <dxc:XYDiagram2D>
        <dxc:WaterfallSeries2D.ValueOptions>
            <dxc:WaterfallRelativeValueOptions ShowTotal="True"
                                               TotalLabel="Total">
                <dxc:WaterfallRelativeValueOptions.Subtotals>
                    <dxc:Subtotal PointIndex="2" Label="Subtotal"/>
                </dxc:WaterfallRelativeValueOptions.Subtotals>
            </dxc:WaterfallRelativeValueOptions>
        </dxc:WaterfallSeries2D.ValueOptions>
        <dxc:WaterfallSeries2D DisplayName="Waterfall"
                               DataSource="{Binding}"
                               ArgumentScaleType="Qualitative"
                               ArgumentDataMember="Argument"
                               ValueDataMember="Value"
                               CrosshairLabelPattern="{}{V}"
                               RisingBarBrush="#FF92CEB5"
                               FallingBarBrush="#FFDA5859"
                               LabelsVisibility="True">
        </dxc:WaterfallSeries2D>
        <dxc:XYDiagram2D.AxisY>
            <dxc:AxisY2D>
                <dxc:AxisY2D.WholeRange>
                    <dxc:Range dxc:AxisY2D.AlwaysShowZeroLevel="False"/>
                </dxc:AxisY2D.WholeRange>
            </dxc:AxisY2D>
        </dxc:XYDiagram2D.AxisY>
    </dxc:XYDiagram2D>
</dxc:ChartControl>
Related API Members:
- WaterfallValueOptionsBase.ShowTotal - Gets or sets whether to show the total bar.
- WaterfallValueOptionsBase.TotalLabel - Gets or sets the waterfall total bar’s string label that is used in the axis label and crosshair.
- WaterfallValueOptionsBase.Subtotals - Returns a collection of waterfall chart subtotals.
- Subtotal - A waterfall subtotal.
- Subtotal.PointIndex - Gets or sets an index of a waterfall point, after which a subtotal should be inserted.
- Subtotal.Label - A waterfall subtotal.
Customize Waterfall Appearance
You can change the color of rising bars, falling bars, the total, subtotals, connectors, and the start bar. The Chart Control also allows you to customize the line style of connectors.
<dxc:XYDiagram2D dxc:WaterfallSeries2D.SubtotalBarBrush="DarkGray"
                 dxc:WaterfallSeries2D.TotalBarBrush="Gray"
                 dxc:WaterfallSeries2D.StartBarBrush="LightGray"
                 dxc:WaterfallSeries2D.ConnectorBrush="Black">
    <dxc:WaterfallSeries2D.ConnectorStyle>
        <dxc:LineStyle Thickness="1"/>
    </dxc:WaterfallSeries2D.ConnectorStyle>
    <dxc:WaterfallSeries2D RisingBarBrush="#FF92CEB5"
                           FallingBarBrush="#FFDA5859">
    </dxc:WaterfallSeries2D>
</dxc:XYDiagram2D>
Related API Members:
- WaterfallSeries2D.RisingBarBrush - Gets or sets the rising bar color.
- WaterfallSeries2D.FallingBarBrush - Gets or sets the falling bar color.
- WaterfallSeries2D.SubtotalBarBrush - Gets or sets the subtotal bar brush.
- WaterfallSeries2D.TotalBarBrush - Gets or sets the total bar brush.
- WaterfallSeries2D.StartBarBrush - Gets or sets the start bar brush.
- WaterfallSeries2D.ConnectorBrush - Gets or sets the connector brush.
- WaterfallSeries2D.ConnectorStyle - Gets or sets the connector style settings.
Format the Crosshair Label and Series Labels
You can format the crosshair label‘s and series labels‘ text. To do this, use the XYSeries2D.CrosshairLabelPattern and SeriesLabel.TextPattern properties. The Chart Control provides a {VABS} placeholder that displays an absolute point value. The {V} placeholder shows value changes for rising and falling bars, and the absolute value for the Total bar.
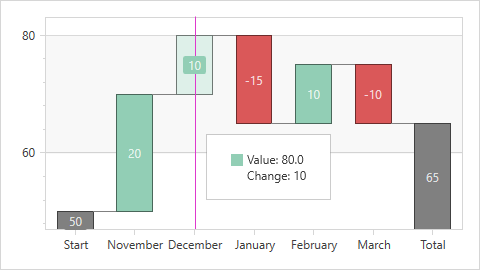
<dxc:WaterfallSeries2D CrosshairLabelPattern="Value: {VABS:f1}
Change: {V}"
LabelsVisibility="True">
<dxc:WaterfallSeries2D.Label>
<dxc:SeriesLabel TextPattern="{}{V}"/>
</dxc:WaterfallSeries2D.Label>
</dxc:WaterfallSeries2D>
Specify Series Label Position
To specify waterfall series label position, use the WaterfallSeries2D.LabelPosition property. The WaterfallLabelPosition enumeration lists the available values.
<dxc:WaterfallSeries2D LabelsVisibility="True">
    <dxc:WaterfallSeries2D.Label>
        <dxc:SeriesLabel dxc:WaterfallSeries2D.LabelPosition="InsideEnd"/>
    </dxc:WaterfallSeries2D.Label>
</dxc:WaterfallSeries2D>
Create a Chart with Multiple Waterfall Series
You can create a waterfall chart with multiple series. In this case, the chart displays points of different series as stacked bars:
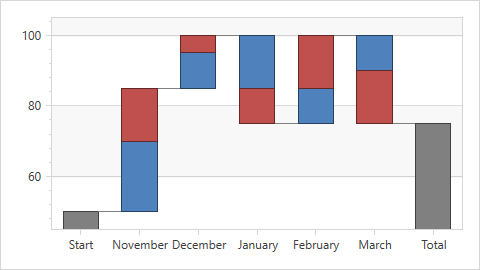
To create such a chart, use a series template to generate series or add multiple series.
Markup:
<dxc:ChartControl>
    <dxc:XYDiagram2D SeriesItemsSource="{Binding Data}">
        <dxc:WaterfallSeries2D.ValueOptions>
            <dxc:WaterfallRelativeValueOptions StartBarValue="50"
                                               StartBarLabel="Start"/>
        </dxc:WaterfallSeries2D.ValueOptions>
        <dxc:XYDiagram2D.SeriesItemTemplate>
            <DataTemplate>
                <dxc:WaterfallSeries2D DisplayName="{Binding Name}"
                                       DataSource="{Binding Points}"
                                       ArgumentScaleType="Qualitative"
                                       ArgumentDataMember="Argument"
                                       ValueDataMember="Value">
                </dxc:WaterfallSeries2D>
            </DataTemplate>
        </dxc:XYDiagram2D.SeriesItemTemplate>
        <dxc:XYDiagram2D.AxisY>
            <dxc:AxisY2D>
                <dxc:AxisY2D.WholeRange>
                    <dxc:Range dxc:AxisY2D.AlwaysShowZeroLevel="False"/>
                </dxc:AxisY2D.WholeRange>
            </dxc:AxisY2D>
        </dxc:XYDiagram2D.AxisY>
    </dxc:XYDiagram2D>
</dxc:ChartControl>
Code-Behind:
using System.Collections.Generic;
using System.Windows;

namespace WatefallChart {
    public partial class MainWindow : Window {
        public MainWindow() {
            InitializeComponent();
            this.DataContext = new ChartViewModel();
        }
    }
    class ChartViewModel {
        public static List<DataSeries> Data { get; private set; }
        public ChartViewModel() {
            Data = new List<DataSeries> {
                new DataSeries (name:"2017", points: new List<DataPoint> {
                     new DataPoint("November", 20),
                     new DataPoint("December", 10),
                     new DataPoint("January", -15),
                     new DataPoint("February", 10),
                     new DataPoint("March",   -10)
                }),
                new DataSeries (name:"2018", points: new List<DataPoint> {
                     new DataPoint("November", 15),
                     new DataPoint("December", 5),
                     new DataPoint("January", -10),
                     new DataPoint("February", 15),
                     new DataPoint("March",   -15)
                })
            };
        }
    }
    public class DataSeries {
        public string Name { get; set; }
        public List<DataPoint> Points { get; set; }
        public DataSeries(string name, List<DataPoint> points) {
            this.Name = name;
            this.Points = points;
        }
    }
    public class DataPoint {
        public string Argument { get; private set; }
        public double Value { get; private set; }
        public DataPoint(string arg, double val) {
            Argument = arg;
            Value = val;
        }
    }
}
Note
Values of the following attached properties are synchronized in all waterfall series in the Chart Control. If you change these properties’ values for any waterfall series, the Chart Control applies the same value to all other waterfall series.