Histogram
- 6 minutes to read
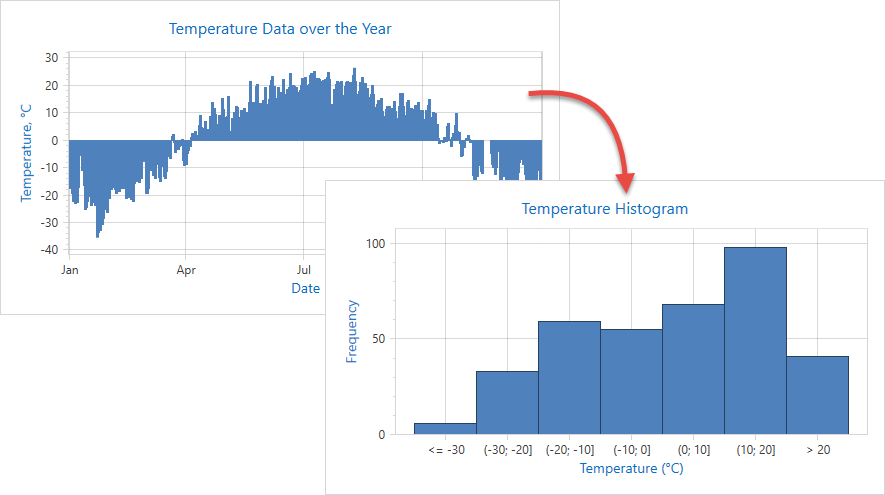
This topic explains how to customize the Chart Control’s axis and series settings to make a histogram.
Required Steps
Optional Steps
- Specify Side Bin Thresholds
- Specify Bar Width
- Configure the Grid and Label Layout
- Customize Axis Label Text
Specify a Data Source
You can provide histogram data to a chart in the following ways:
Define a data source field that provides series arguments. You do not have to supply data for series point values. The Chart Control calculates values as aggregates based on the frequency of arguments.
You can use a one-dimensional array as a data source. In this case, you do not have to specify the argument data member.
You can use the following API:
| Member | Description |
|---|---|
| ChartControl.DataSource (Series.DataSource) | Specifies the chart control (series) data source. |
| Series.ArgumentDataMember | Gets or sets the name of the data field which contains arguments for generated series points. |
<dxc:ChartControl x:Name="chartControl">
    <dxc:ChartControl.Titles>
        <dxc:Title HorizontalAlignment="Center"
                   Content="Temperature Histogram"/>
    </dxc:ChartControl.Titles>
    <dxc:XYDiagram2D>
        <dxc:BarSideBySideSeries2D  DisplayName="Histogram"
                                    DataSource="{Binding}"
                                    ArgumentDataMember="Temperature">
        </dxc:BarSideBySideSeries2D>
    </dxc:XYDiagram2D>
</dxc:ChartControl>
The data structure looks as follows:
<?xml version="1.0"?>
<CityDailyWeather xmlns:xsi="http://www.w3.org/2001/XMLSchema-instance"
                    xmlns:xsd="http://www.w3.org/2001/XMLSchema">
  <xs:schema xmlns:xs="http://www.w3.org/2001/XMLSchema">
    <xs:element name="WeatherItem">
      <xs:complexType>
        <xs:sequence>
          <xs:element name="Date" type="xs:dateTime"/>
          <xs:element name="Temperature" type="xs:double"/>
        </xs:sequence>
      </xs:complexType>
    </xs:element>
  </xs:schema>
  <WeatherItem>
    <Date>2018-01-01T00:00:00</Date>
    <Temperature>-17.5</Temperature>
  </WeatherItem>
  <WeatherItem>
    <Date>2018-01-02T00:00:00</Date>
    <Temperature>-16.3</Temperature>
  </WeatherItem>
  <!--...-->
</CityDailyWeather>
Aggregate Data and Divide an Axis Scale into Bins
The Number of Bins is Auto-Calculated
The Chart control can apply Scott’s Normal Reference Rule to compute an optimal number of bins and their ranges:
Initialize the AxisX2D.NumericScaleOptions property with a new IntervalNumericScaleOptions object. (For date-time axes, use AxisX2D.DateTimeScaleOptions and IntervalDateTimeScaleOptions instead.)
Set the ManualNumericScaleOptions.AggregateFunction property to Histogram.
<dxc:XYDiagram2D>
    <dxc:XYDiagram2D.AxisX>
        <dxc:AxisX2D>
            <dxc:AxisX2D.NumericScaleOptions>
                <dxc:IntervalNumericScaleOptions AggregateFunction="Histogram"/>
            </dxc:AxisX2D.NumericScaleOptions>
        </dxc:AxisX2D>
    </dxc:XYDiagram2D.AxisX>
    <!-- Series settings are skipped. -->
</dxc:XYDiagram2D>
Specify the Number of Bins
The Chart Control can display a specified number of bins for numeric axes. The bin value range is calculated automatically.
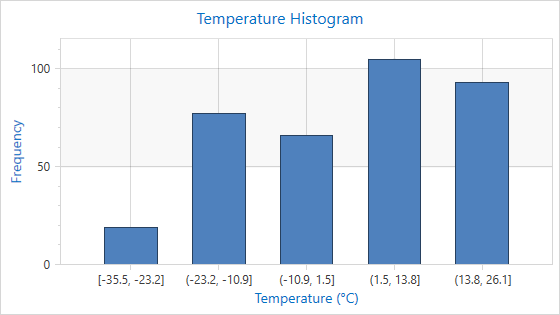
The following code creates a histogram with five bins:
<dxc:XYDiagram2D>
    <dxc:XYDiagram2D.AxisX>
        <dxc:AxisX2D TickmarksMinorVisible="False"
                     GridLinesVisible="True">
            <dxc:AxisX2D.NumericScaleOptions>
                <!-- Configure a histogram with the specified number of bins. -->
                <dxc:CountIntervalNumericScaleOptions AggregateFunction="Histogram"
                                                      Count="5"/>
            </dxc:AxisX2D.NumericScaleOptions>
        </dxc:AxisX2D>
    </dxc:XYDiagram2D.AxisX>
</dxc:XYDiagram2D>
The following table lists the API members used in the code above:
| Member | Description |
|---|---|
| CountIntervalNumericScaleOptions | These options provide the Count property. Use this property to specify the number of bins. |
| CountIntervalNumericScaleOptions.Count | Gets or sets the number of intervals. |
Specify the Bin Size
You can specify the bin size (measured in x-axis units). The number of bins is calculated automatically.
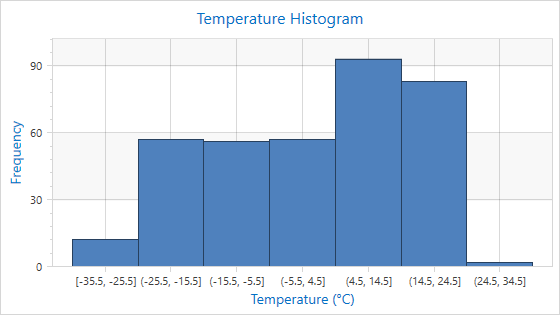
The code below creates bins with a size equal to ten x-axis measurement units:
<dxc:XYDiagram2D>
    <dxc:XYDiagram2D.AxisX>
        <dxc:AxisX2D TickmarksMinorVisible="False"
                     GridLinesVisible="True">
            <dxc:AxisX2D.NumericScaleOptions>
                <!-- Configure a histogram with bins of specified width. -->
                <dxc:WidthIntervalNumericScaleOptions AggregateFunction="Histogram"
                                                      Width="10"/>
            </dxc:AxisX2D.NumericScaleOptions>
        </dxc:AxisX2D>
    </dxc:XYDiagram2D.AxisX>
</dxc:XYDiagram2D>
The following table lists the API members used in the code above:
| Member | Description |
|---|---|
| WidthIntervalNumericScaleOptions | The options that provide means to create axis intervals with a specified width. |
| WidthIntervalNumericScaleOptions.Count | Gets or sets the interval width in x-axis measurement units. |
Specify Side Bin Thresholds
You can change thresholds for underflow and overflow bins:
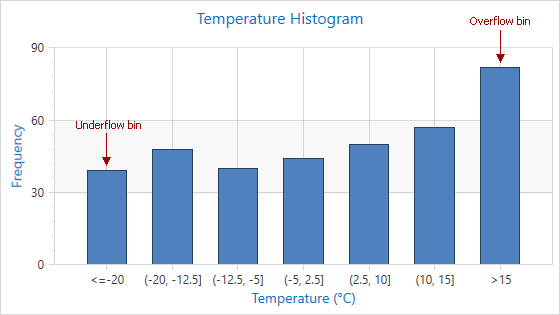
The following code uses the IntervalNumericScaleOptions.UnderflowValue and IntervalNumericScaleOptions.OverflowValue properties to change thresholds. (For date-time axes, use IntervalDateTimeScaleOptions.UnderflowValue and IntervalDateTimeScaleOptions.OverflowValue instead.)
<dxc:XYDiagram2D>
    <dxc:XYDiagram2D.AxisX>
        <dxc:AxisX2D TickmarksMinorVisible="False"
                     GridLinesVisible="True">
            <dxc:AxisX2D.NumericScaleOptions>
                <dxc:IntervalNumericScaleOptions AggregateFunction="Histogram"
                                                 UnderflowValue="-20"
                                                 OverflowValue="15"/>
            </dxc:AxisX2D.NumericScaleOptions>
        </dxc:AxisX2D>
    </dxc:XYDiagram2D.AxisX>
</dxc:XYDiagram2D>
Specify Bar Width
A histogram can use bars positioned next to each other without gaps to display histogram bins.
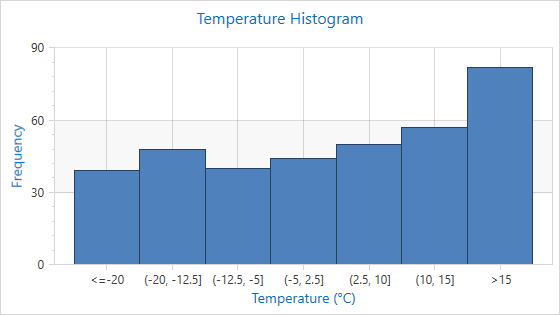
Set the BarSeries2DBase.BarWidth property to 1 to remove gaps between bars.
<dxc:XYDiagram2D>
    <dxc:BarSideBySideSeries2D  DisplayName="Histogram"
                                DataSource="{Binding}"
                                ArgumentDataMember="Temperature"
                                BarWidth="1">
    </dxc:BarSideBySideSeries2D>
    <dxc:XYDiagram2D.AxisX>
        <dxc:AxisX2D TickmarksMinorVisible="False"
                     GridLinesVisible="True">
            <dxc:AxisX2D.NumericScaleOptions>
                <dxc:IntervalNumericScaleOptions AggregateFunction="Histogram"
                                                 UnderflowValue="-20"
                                                 OverflowValue="15"/>
            </dxc:AxisX2D.NumericScaleOptions>
            <dxc:AxisX2D.WholeRange>
                <dxc:Range SideMarginsValue="0.8"/>
            </dxc:AxisX2D.WholeRange>
        </dxc:AxisX2D>
    </dxc:XYDiagram2D.AxisX>
</dxc:XYDiagram2D>
Configure the Grid and Label Layout
The Chart Control aligns axis labels, major grid lines, and major tick marks to the center of each bin. You can also align them to the start of each interval.

Specify the GridLayoutMode (IntervalNumericScaleOptions.GridLayoutMode, DateTimeScaleOptionsBase.GridLayoutMode or QualitativeScaleOptions.GridLayoutMode) property to change the axis label, grid line, or tick mark alignment.
<dxc:XYDiagram2D>
    <dxc:XYDiagram2D.AxisX>
        <dxc:AxisX2D TickmarksMinorVisible="False"
                     GridLinesVisible="True">
            <dxc:AxisX2D.NumericScaleOptions>
                <dxc:IntervalNumericScaleOptions AggregateFunction="Histogram"
                                                 GridLayoutMode="GridAndLabelShifted"
                                                 UnderflowValue="-20"
                                                 OverflowValue="15"/>
            </dxc:AxisX2D.NumericScaleOptions>
            <dxc:AxisX2D.Label>
                <dxc:AxisLabel TextPattern="{}{A:F0}°C"/>
            </dxc:AxisX2D.Label>
        </dxc:AxisX2D>
    </dxc:XYDiagram2D.AxisX>
</dxc:XYDiagram2D>
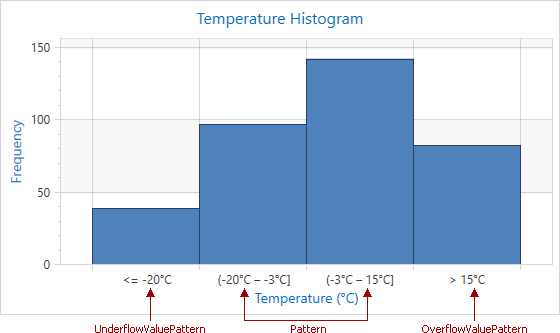
Customize Axis Label Text
You can format label text for axis scale intervals and the underflow/overflow bins.
<dxc:XYDiagram2D>
    <dxc:XYDiagram2D.AxisX>
        <dxc:AxisX2D TickmarksMinorVisible="False"
                     GridLinesVisible="True">
            <dxc:AxisX2D.NumericScaleOptions>
                   <dxc:CountIntervalNumericScaleOptions AggregateFunction="Histogram"
                                             Pattern="{}{OB}{A1:F0}°C – {A2:F0}°C{CB}"
                                             UnderflowValuePattern="{}{US} {A2}°C"
                                             OverflowValuePattern="{}{OS} {A1}°C"
                                             GridLayoutMode="GridShiftedLabelCentered"
                                             UnderflowValue="-20"
                                             OverflowValue="15"
                                             Count="4"/>
            </dxc:AxisX2D.NumericScaleOptions>
        </dxc:AxisX2D>
    </dxc:XYDiagram2D.AxisX>
</dxc:XYDiagram2D>
The following table lists the API members the code above uses:
| Member | Description |
|---|---|
| IntervalNumericScaleOptions.Pattern | Gets or sets a format string that configures text for the interval axis labels and crosshair labels. |
| IntervalNumericScaleOptions.UnderflowValuePattern | Gets or sets a format string that configures text for the underflow interval axis labels and crosshair labels. |
| IntervalNumericScaleOptions.OverflowValuePattern | Gets or sets a format string that configures text for the overflow interval axis labels and crosshair labels. |
Patterns can contain regular text (displayed as is) and value placeholders in braces. To format numeric and date/time values, you can apply Format Specifiers. Use a colon to separate a placeholder and its format specifier. In XAML, insert an escape sequence ({}) into the beginning of a pattern if it starts with a placeholder.
The following table contains the available placeholders:
| Placeholder | Description |
|---|---|
| {OB} | Displays an opening bracket. |
| {CB} | Displays a closing bracket. |
| {OS} | Displays the greater than sign. |
| {US} | Displays the less than or less than or equal to sign. |
| {A1} | Displays the interval start value. |
| {A2} | Displays the interval end value. |
Note
Use the AxisLabel.TextPattern property to format label text when the GridLayoutMode (IntervalNumericScaleOptions.GridLayoutMode, DateTimeScaleOptionsBase.GridLayoutMode or QualitativeScaleOptions.GridLayoutMode) property is set to GridAndLabelShifted.