Best Practices: Display Large Data
- 4 minutes to read
A chart’s performance directly relates to how many points and elements it displays: fewer elements result in higher performance. This topic explains how to reduce the number of data points and enhance the chart’s performance.
- Data Aggregation
- Loading Data
- Automatic Calculations
- Visual Elements
- Interactivity Optimization
- Changeable Data
Data Aggregation
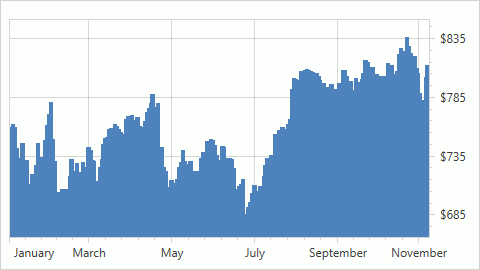
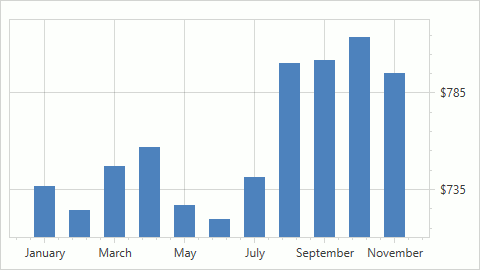
Data Aggregation groups raw data points into points with a larger argument measurement unit. When the Aggregation is enabled, the chart splits the x-axis into intervals (that the measurement unit value defines), and uses an aggregation function to automatically aggregate data for each interval:
| Non-aggregated data | Data aggregated by month |
|---|---|
 |
 |
Loading Data
The following approaches reduce the time the chart control takes to load data:
Store all data points in as few series as possible. The Chart control is optimized to render a small number of series with many points, rather than a large number of series with a few points. For example, a single series with a million points is processed faster than 10 series with 100000 points each.
You can enclose the code that adds points in the ChartControl.BeginInit and ChartControl.EndInit methods’ calls to avoid frequent chart updates:
chartControl.BeginInit();
for(int i = 0; i < PointsCount; i++) {
    chartControl.Diagram.Series[0].Points.Add(new SeriesPoint(i, i));
}
chartControl.EndInit();
- The best way to add points to the series is to use a single operation instead of adding each point separately:
SeriesPoint[] points = new SeriesPoint[PointsCount];
for (int i = 0; i < PointsCount; i++) {
    points[i] = new SeriesPoint(i, i);
}
chartControl.Diagram.Series[0].Points.AddRange(points);
The Chart Control renders series with manually added points faster than series bound to a data source or automatically generated series.
You can use the Series.DataSourceSorted property to notify the chart that the series’s data source is already sorted to prevent the chart’s internal sorting procedures.
Automatic Calculations
The range, scale type, and layout’s automatic calculations require additional resources.
Use the Range.SetMinMaxValues method to define an AxisBase.WholeRange‘s limits for x- and y-axes if the points’ argument and value range are known. Refer to the Whole and Visual Ranges document for more information on axis ranges.
Set the ChartControl.AutoLayout property to false.
Define a scale type for series points’ arguments if possible. For this, set the Series.ArgumentScaleType property to the ScaleType.Numerical, ScaleType.DateTime or ScaleType.Qualitative value depending on your data type. A chart should perform additional calculations to determine the actual scale type when ScaleType.Auto is used. Note that a chart achieves the best possible performance when it has the Numerical arguments’ axis scale type. However, the DateTime scale type does not suffer from significant performance degradation. In comparison with them, the Qualitative scale type requires more resources to process data values.
Visual Elements
Follow the steps below to decrease the time needed to render a chart’s visual elements:
Avoid to use templates to customize chart elements’ appearance and behavior.
The Chart control needs additional resources to handle the ChartControl.CustomDrawSeriesPoint event. Place points that should be customized in a separate series.
Use a single color to paint series points. Avoid to use the XYSeries.ColorEach property.
Each additional chart element (for example, a series point label) requires extra rendering time. This also applies to visual effects, for instance, chart elements’ shadows.
Use the LineSeries2D to represent a large amount of data. Disable point markers (LineSeries2D.MarkerVisible) when you use the LineSeries2D and its descendants. Also, modify the LineSeries2D.LineStyle property’s line style settings as follows:
Set the LineStyle.Thickness property to 1 or 2.
Assign the LineJoin.Bevel value to the LineStyle.LineJoin property.
Use small values to define the PointSeries2D.MarkerSize property.
Assign a BorderlessSimpleMarker2DModel object to the PointSeries2D.MarkerModel property.
Customize the following parameters to optimize a Bar Series:
Set the XYDiagram2D.EqualBarWidth property to true.
Assign a BorderlessSimpleBar2DModel object to the BarSeries2D.Model property.
Interactivity Optimization
The selection and tooltips features require additional CPU and RAM resources and may decrease performance.
Set ChartControl.SelectionMode to None.
Use the Crosshair Cursor functionality instead of Tooltips.
Changeable Data
This section contains tips to enhance performance when a chart shows a dataset that changes frequently.
Remove an existing point and add a new one instead to update the chart’s data. The existing SeriesPoint argument/value change results in unnecessary calculations. For example, the SeriesPoint.Value property’s change entails the chart content’s update.
The Chart Control handles the following events to avoid to reload all data when the chart is bound to a dataset that updates frequently:
For this reason, use the IBindingList and ObservableCollection<T> objects to provide data to the chart control when it should display data that updates frequently.