Pane Layout
- 5 minutes to read
This document explains how to arrange panes within a diagram. You can sequentially position panes or configure the table layout to arrange panes in a grid of rows and columns.
Specify Pane Orientation
The Chart control can sequentially arrange panes. The XYDiagram2D.PaneOrientation property defines whether panes are orientated vertically or horizontally.
| Orientation | Example |
|---|---|
| PaneOrientation = Vertical (default) |  |
| PaneOrientation = Horizontal |  |
Specify Pane Position
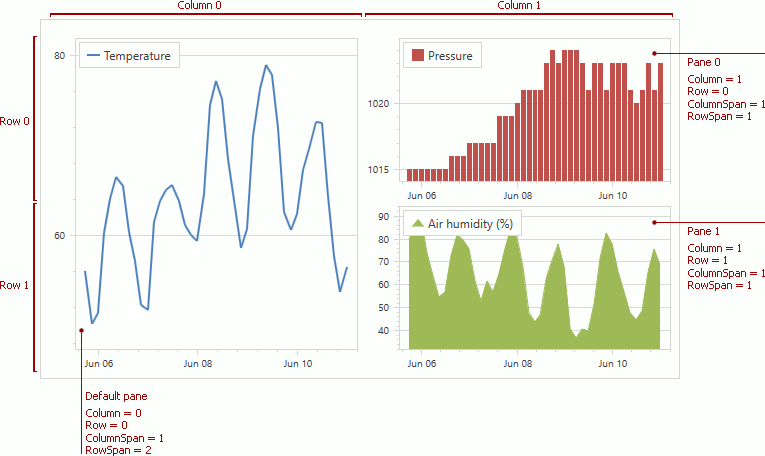
The Chart control can arrange panes using a grid of columns and rows. Use row and column indices to specify a pane’s position. The following image shows three panes in a grid with two columns and two rows:
Specify Pane Layout at Design Time
The following markup allows you to specify the pane layout at design time:
<dxc:XYDiagram2D.PaneLayout>
    <dxc:GridLayout>
        <dxc:GridLayout.ColumnDefinitions>
            <dxc:LayoutDefinition/>
            <dxc:LayoutDefinition/>
        </dxc:GridLayout.ColumnDefinitions>
        <dxc:GridLayout.RowDefinitions>
            <dxc:LayoutDefinition/>
            <dxc:LayoutDefinition/>
        </dxc:GridLayout.RowDefinitions>
    </dxc:GridLayout>
</dxc:XYDiagram2D.PaneLayout>
<dxc:XYDiagram2D.DefaultPane>
    <dxc:Pane dxc:GridLayout.Column="0"
              dxc:GridLayout.Row="0"
              dxc:GridLayout.RowSpan="2"
              x:Name="temperaturePane"/>
</dxc:XYDiagram2D.DefaultPane>
<dxc:XYDiagram2D.Panes>
    <dxc:Pane dxc:GridLayout.Column="1"
              dxc:GridLayout.Row="0"
              x:Name="pressurePane"/>
    <dxc:Pane dxc:GridLayout.Column="1"
              dxc:GridLayout.Row="1"
              x:Name="humidityPane"/>
</dxc:XYDiagram2D.Panes>
The code above uses the following API members:
| Member | Description |
|---|---|
| XYDiagram2D.PaneLayout | Gets or sets the pane layout configuration. |
| GridLayout | The settings that configure a chart’s panes in a grid layout. |
| GridLayout.ColumnDefinitions | Returns the grid layout’s columns. |
| LayoutDefinition | A layout element (row or column) used to arrange panes. |
| GridLayout.RowDefinitions | Returns the grid layout’s rows. |
| GridLayout.Column | Gets or sets the index of the grid column the pane occupies. |
| GridLayout.Row | Gets or sets the index of the grid row the pane occupies. |
| GridLayout.ColumnSpan | Gets or sets the number of the grid columns the pane occupies. |
| GridLayout.RowSpan | Gets or sets the number of grid rows that the pane occupies. |
Specify Pane Layout at Runtime
The following code allows you to specify pane layout at runtime:
<dxc:XYDiagram2D.DefaultPane>
    <dxc:Pane x:Name="temperaturePane"/>
</dxc:XYDiagram2D.DefaultPane>
<dxc:XYDiagram2D.Panes>
    <dxc:Pane x:Name="pressurePane"/>
    <dxc:Pane x:Name="humidityPane"/>
</dxc:XYDiagram2D.Panes>
GridLayout gridLayout = new GridLayout();
gridLayout.ColumnDefinitions.Add(new LayoutDefinition());
gridLayout.ColumnDefinitions.Add(new LayoutDefinition());
gridLayout.RowDefinitions.Add(new LayoutDefinition());
gridLayout.RowDefinitions.Add(new LayoutDefinition());
diagram.PaneLayout = gridLayout;

GridLayout.SetColumn(temperaturePane, 0);
GridLayout.SetRow(temperaturePane, 0);
GridLayout.SetRowSpan(temperaturePane, 2);

GridLayout.SetColumn(pressurePane, 1);
GridLayout.SetRow(pressurePane, 0);

GridLayout.SetColumn(humidityPane, 1);
GridLayout.SetRow(humidityPane, 1);
You can use the following methods to specify a pane’s position:
| Method | Description |
|---|---|
| GridLayout.SetColumn | Specifies the index of the grid column the pane occupies. |
| GridLayout.SetRow | Specifies the index of the grid row the pane occupies. |
| GridLayout.SetColumnSpan | Sets the number of columns that the pane occupies. |
| GridLayout.SetRowSpan | Sets the number of rows that the pane occupies. |
Enable Auto Arrangement in a Grid
The Chart control determines panes’ position and size if you assign a new GridLayout instance to XYDiagram2D.PaneLayout, and do not populate the GridLayout.ColumnDefinitions and GridLayout.RowDefinitions collections with items.
<dxc:XYDiagram2D.PaneLayout>
    <dxc:GridLayout/>
</dxc:XYDiagram2D.PaneLayout>

<dxc:XYDiagram2D.DefaultPane>
    <dxc:Pane x:Name="temperaturePane"/>
</dxc:XYDiagram2D.DefaultPane>
<dxc:XYDiagram2D.Panes>
    <dxc:Pane x:Name="pressurePane"/>
    <dxc:Pane x:Name="humidityPane"/>
</dxc:XYDiagram2D.Panes>
Specify Panes Size
A pane’s size depends on the size of the column and row that define this pane’s position.
You can specify column/row size as an absolute value in pixels. In this case, a row or column size does not change when an end user resizes the Chart control. You can define a pane’s size relative to the chart’s size using weights. In this case, a row or column is resized proportionally to a diagram when an end user resizes the Chart control.
The images below illustrate how pane sizes are changed when a chart is resized:
480x270 pixels

560x360 pixels

Specify Panes Size at Design Time
In XAML, you can use a numeric value with an asterisk to specify a column’s or row’s relative size. In this case, the value defines which portion of the available chart space this column or row should occupy. Use a value without an asterisk to specify column or row size in pixels.
The following markup specifies the layout’s column and row sizes using the LayoutDefinition.Size property:
<dxc:XYDiagram2D.PaneLayout>
    <dxc:GridLayout>
        <dxc:GridLayout.ColumnDefinitions>
            <dxc:LayoutDefinition Size="200"/>
            <dxc:LayoutDefinition Size="1*"/>
        </dxc:GridLayout.ColumnDefinitions>
        <dxc:GridLayout.RowDefinitions>
            <dxc:LayoutDefinition Size="100"/>
            <dxc:LayoutDefinition Size="2*"/>
            <dxc:LayoutDefinition Size="3*"/>
        </dxc:GridLayout.RowDefinitions>
    </dxc:GridLayout>
</dxc:XYDiagram2D.PaneLayout>
Specify Pane Sizes at Runtime
The code below specifies column and row sizes at runtime:
private void Window_Loaded(object sender, RoutedEventArgs e) {
    GridLayout gridLayout = new GridLayout();
    gridLayout.ColumnDefinitions.Add(new LayoutDefinition { Size = new LayoutSizeValue(200, LayoutSizeValueType.Absolute)});
    gridLayout.ColumnDefinitions.Add(new LayoutDefinition { Size = new LayoutSizeValue(1, LayoutSizeValueType.Weight)});
    gridLayout.RowDefinitions.Add(new LayoutDefinition { Size = new LayoutSizeValue(100, LayoutSizeValueType.Absolute)});
    gridLayout.RowDefinitions.Add(new LayoutDefinition { Size = new LayoutSizeValue(2, LayoutSizeValueType.Weight)});
    gridLayout.RowDefinitions.Add(new LayoutDefinition { Size = new LayoutSizeValue(3, LayoutSizeValueType.Weight)});
    diagram.PaneLayout = gridLayout;
}
The following table lists the API members that the code above uses:
| Member | Description |
|---|---|
| LayoutDefinition.Size | Specifies a layout item’s size. |
| LayoutSizeValueType | Lists types of measurement units in which the diagram layout measures its items’ sizes. |
Specify Sizes of Sequentially Arranged Panes
You can use the ~Span properties to specify relative sizes of panes that are vertically or horizontally arranged:
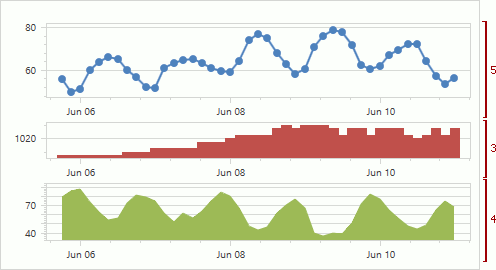
Use the following code to configure panes’ size when XYDiagram2D.PaneOrientation is Vertical:
<dxc:XYDiagram2D.PaneLayout>
    <dxc:GridLayout>
        <dxc:GridLayout.ColumnDefinitions>
            <dxc:LayoutDefinition/>
        </dxc:GridLayout.ColumnDefinitions>
    </dxc:GridLayout>
</dxc:XYDiagram2D.PaneLayout>

<dxc:XYDiagram2D.DefaultPane>
    <dxc:Pane x:Name="temperaturePane"
              dxc:GridLayout.RowSpan="5"/>
</dxc:XYDiagram2D.DefaultPane>
<dxc:XYDiagram2D.Panes>
    <dxc:Pane x:Name="pressurePane"
              dxc:GridLayout.RowSpan="3"/>
    <dxc:Pane x:Name="humidityPane"
              dxc:GridLayout.RowSpan="4"/>
</dxc:XYDiagram2D.Panes>
Use the GridLayout.RowDefinitions and GridLayout.ColumnSpan properties instead of GridLayout.ColumnDefinitions and GridLayout.RowSpan when XYDiagram2D.PaneOrientation is Horizontal.
Expand and Collapse Panes
End users can click the pane title or its expand button to expand or collapse panes at runtime. The Chart control recalculates other panes’ sizes to occupy all the available place within the diagram when an end user collapses the pane. The XYDiagram2D.RuntimePaneCollapse property allows you to enable collapsing panes. Use the Pane.RuntimeCollapse property to specify whether end users can collapse or expand an individual pane.
You can use the Pane.Collapsed property to specify whether the pane is collapsed.