Generate Chart Items Automatically
- 3 minutes to read
The map control supports map chart items used to visualize analytical data. There are two types of chart items supported by the map control: Bubble charts and Pie charts.
Bubble Charts
The BubbleChartDataAdapter class allows you to automatically generate MapBubble objects based on data in a data source. To do this, create a BubbleChartDataAdapter object and assign the required data source containing information about charts to its DataSourceAdapterBase.DataSource property. Then, set this BubbleChartDataAdapter object to a vector layer’s VectorLayer.Data property.
It is necessary to specify the following properties used to generate vector items. To do this, use a MapBubbleMappingInfo object returned by the BubbleChartDataAdapter.Mappings property.
- The MapPointMappingInfoBase.Latitude and MapPointMappingInfoBase.Longitude properties should be mapped to data object properties containing latitude and longitude data.
- The MapBubbleMappingInfo.Value property should be mapped to a data object property containing values for generated Bubble charts.
Note
If you need to provide additional information for generated vector items (e.g., to display this information in tooltips), specify it using the DataSourceAdapterBase.AttributeMappings property of BubbleChartDataAdapter. For detailed information, refer to Provide Data Using Vector Item Attributes.
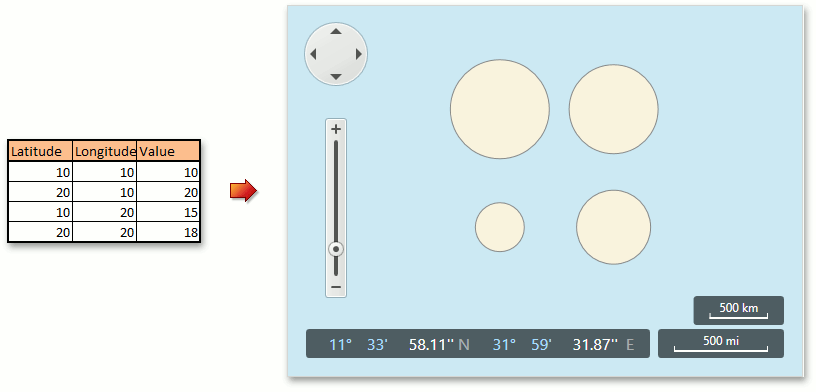
The following image shows automatically generated Bubble charts from a data table.
To learn more on how to bind data using the BubbleChartDataAdapter class, refer to How to: Automatically Generate Bubble Chart Items from a Datasource.
Pie Charts
The PieChartDataAdapter class allows you to automatically generate MapPie objects based on data in a data source. To do this, create a PieChartDataAdapter object and assign the required data source object containing information about charts to the DataSourceAdapterBase.DataSource property. Then, set the PieChartDataAdapter object to the VectorLayer.Data property of a vector layer.
After that, it is necessary to provide values used to unite generated PieSegment objects into Pie charts. To do this, set the name of a data object property containing data about a pie to the ChartDataSourceAdapter.ItemIdDataMember property.
Then, it is necessary to specify the following data object properties used to generate Pie charts. To do this, use a MapPieMappingInfo object returned by the PieChartDataAdapter.Mappings property.
- The MapPointMappingInfoBase.Latitude and MapPointMappingInfoBase.Longitude properties should be mapped to data object properties containing latitude and longitude data.
- The MapPieMappingInfo.SegmentValue property should be mapped to a data object property containing values for generated pie segments.
- The MapPieMappingInfo.SegmentId property should be mapped to a data object property containing arguments for generated pie segments.
Note
If you need to provide additional information for generated vector items (e.g., to display this information in tooltips), specify it using the DataSourceAdapterBase.AttributeMappings property of PieChartDataAdapter. For detailed information, refer to Provide Data Using Vector Item Attributes.
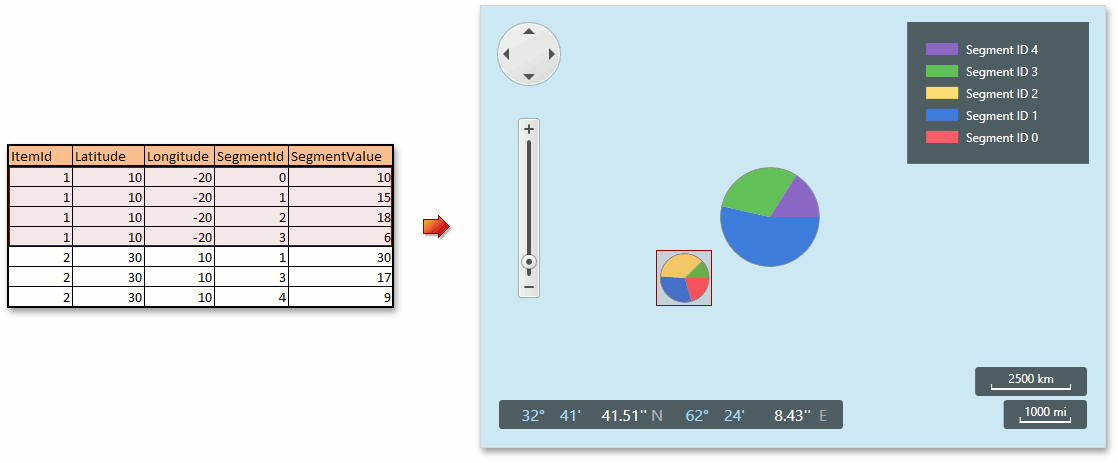
The following image shows automatically generated pie charts from a data table.
To learn more about how to bind data using the PieChartDataAdapter class, refer to How to: Automatically Generate Pie Chart Items from a Datasource.