Lesson 3 - Add Analytical Data to a Geographical Map
- 6 minutes to read
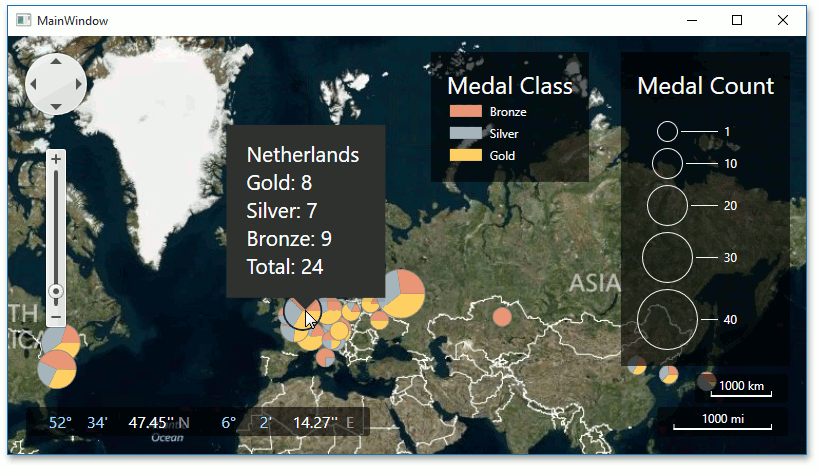
The Map control can visualize data bound to geographical coordinates from various data sources (a database, an XML file, a list of records, etc.). This tutorial describes how to visualize chart data stored in an external XML file. The XML data source contains Olympic Games medals information.
The map control can visualize data from various data sources (a database, a list of records, etc.). In this example, you will use an external XML file.
To bind the map control to an XML data source, follow the instructions below.
- Step 1. Add a Map Control
- Step 2. Configure a Data Source
- Step 3. Customize a Vector Layer
- Step 4. Customize a Colorizer
- Step 5. Adding Legends
- Result
Step 1. Add a Map Control
First, drop a MapControl onto the main form and connect the map to Bing Maps, as you did in Lesson 1. Then, modify its properties as follows.
- Set MapControl.CenterPoint to 10, 40.
- Set MapControl.ZoomLevel to 2.
- Set MapControl.ToolTipEnabled to True.
Step 2. Configure a Data Source
In this step, the XML data will be added to the application. The map control will use this as the data source.
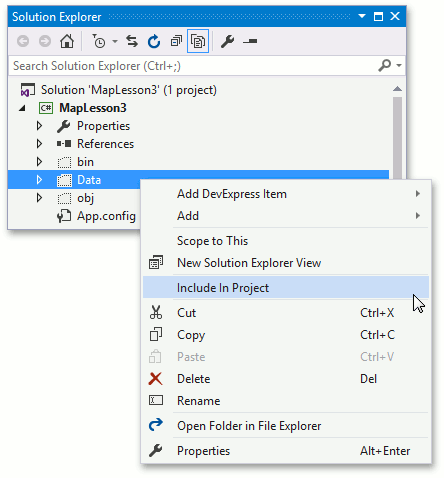
To add an XML data file to the project, do the following:
Copy the shipped with demos sochi2014.xml file to the Data subdirectory of the project and include this XML file into it.
Note
By default the required file is stored in the C:\Users\Public\Documents\DevExpress Demos 18.2\Components\Data folder.
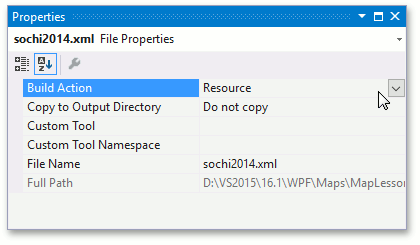
Add the XML file to the WPF application resources.
To do this, click the XML file in the Solution Explorer and in the Properties window, set the Build Action property to Resource.
The XML file was added to the application. Now a XML Data Provider should be added to the application to use an XML file as the data source.
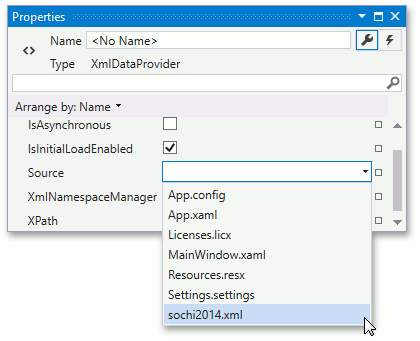
- Add a XmlDataProvider object to a collection of the window’s static resources and set its x:Key property to dataSource.
Set the provider’s Source propertys to sochi2014.xml.
Currently, the data source is ready to use. The following XAML demonstrates the Resources attribute of Window.
<Window.Resources>
    <XmlDataProvider x:Key="dataProvider" Source="sochi2014.xml"/>
</Window.Resources>
Step 3. Customize a Vector Layer
In this step, a VectorLayer object will be added to represent analytical data. To do this, do the following.
Add a VectorLayer to the MapControl.Layers collection.
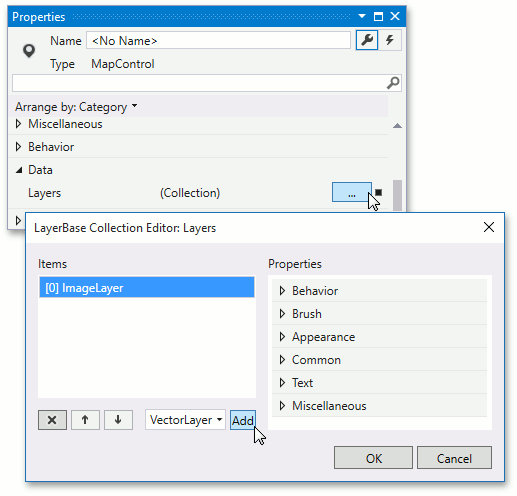
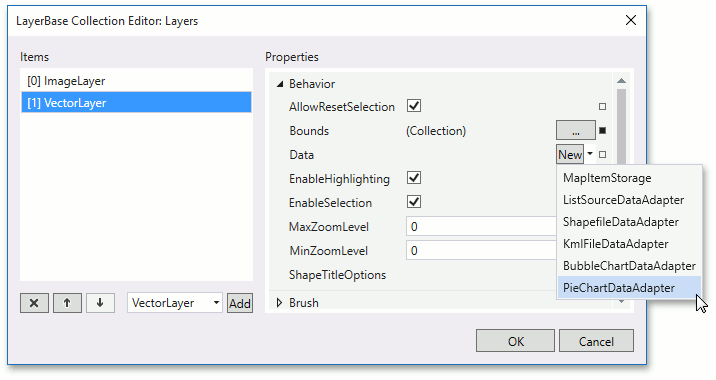
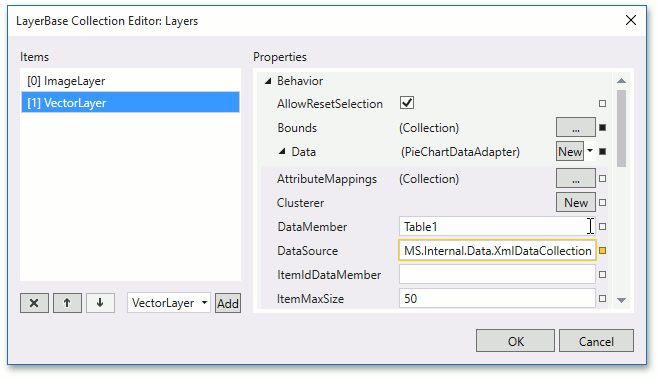
Set the VectorLayer.Data property to PieChartDataAdapter
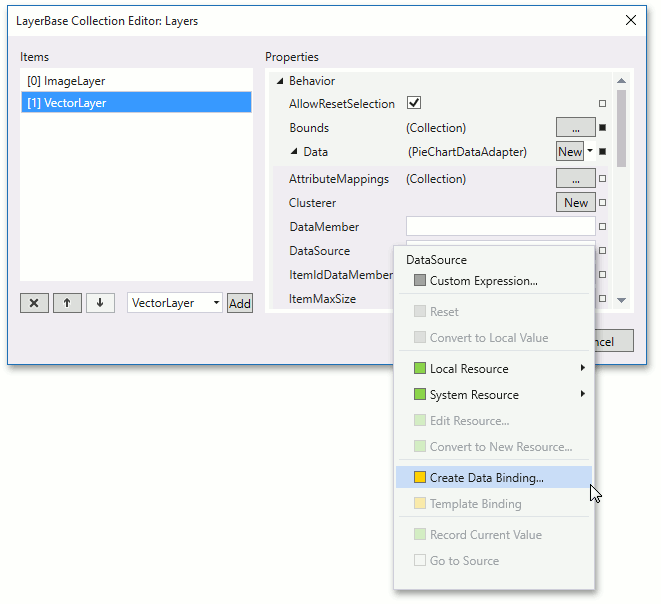
Bind the XML data provider to the pie chart data adapter. To do this, locate the DataSourceAdapterBase.DataSource property, click the property marker, and in the opened list, select Create Data Binding… to invoke the Create Data Binding window.
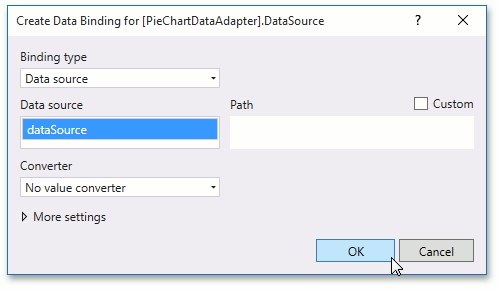
In the invoked window, select the XML Data Provider, added previously and click OK to close the window.
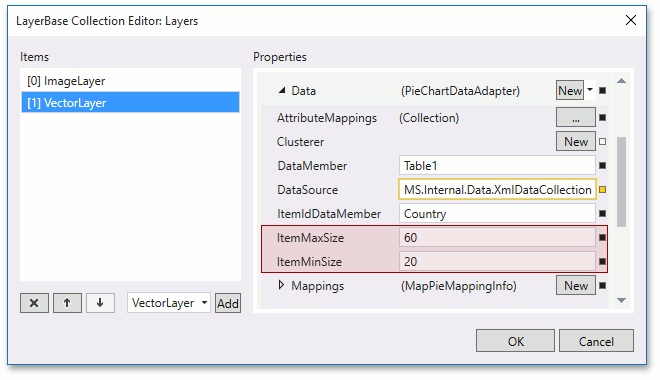
Set the DataSourceAdapterBase.DataMember property to Table1 to use data member with this name as source objects of map pies.
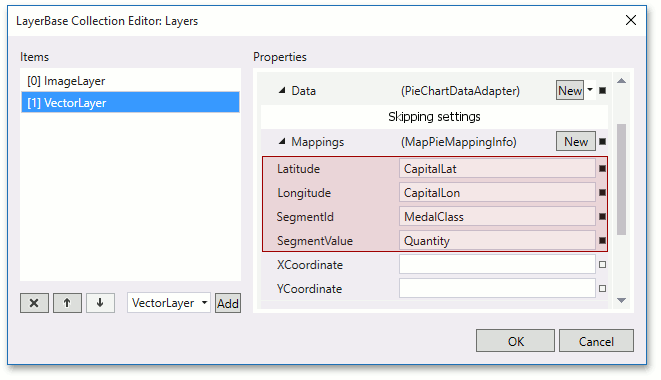
Specify mappings to assign data members values to the generated pie segment properties. Assign an MapPieMappingInfo object to the PieChartDataAdapter.Mappings property. Set MapItemMappingInfoBase.Latitude to CapitalLat, MapItemMappingInfoBase.Longitude to CapitalLon, MapPieMappingInfo.SegmentId to MedalClass, and MapPieMappingInfo.SegmentValue to Quantity.
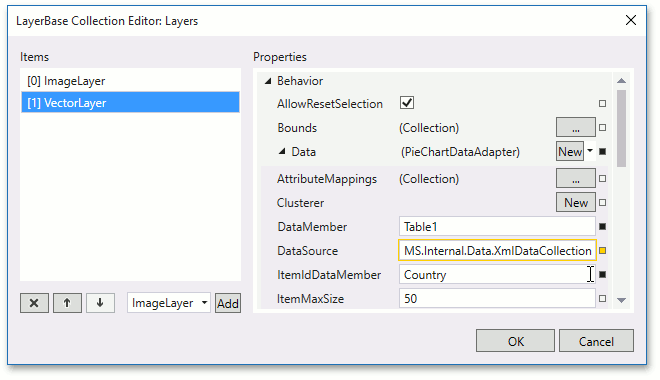
Customize the item ID data member to group adapter generated pie segments to pie charts by this member. Set the ChartDataSourceAdapter.ItemIdDataMember property to Country.
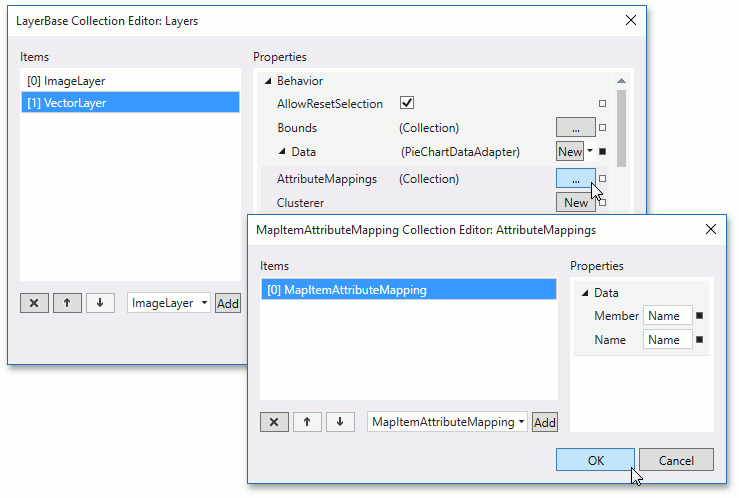
Configure attribute mappings to bind additional information to map items. To do this, locate the DataSourceAdapterBase.AttributeMappings property, click the ellipsis button in the invoked MapItemAttributeMapping Editor window, and add a new attribute mapping and specify its properties as follows.
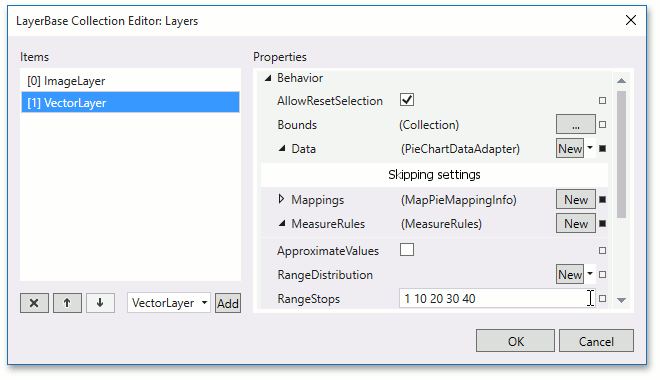
Customize the ChartDataSourceAdapter.MeasureRules property to specify how chart items are ranged by their values. To do this, assign a MeasureRules object to the property and specify the MeasureRules.RangeStops property of this object, as shown below.
Set ChartDataSourceAdapter.ItemMinSize to 20 and ChartDataSourceAdapter.ItemMaxSize to 60.
- Specify the tooltip pattern VectorLayerBase.ToolTipPattern property as {Name} Gold: %V0% Silver: %V1% Bronze: %V2% Total: %V%.
- Click OK to apply the changes.
Now, the vector layer XAML should look as follows.
<dxm:VectorLayer ToolTipPattern="{}{Name} &#13;&#10;Gold: %V0%&#13;&#10;Silver: %V1%&#13;&#10;Bronze: %V2%&#13;&#10;Total: %V%">
<dxm:PieChartDataAdapter DataSource="{Binding Source={StaticResource dataSource}}"
DataMember="Table1"
ItemIdDataMember="Country"
ItemMinSize="20"
ItemMaxSize="60">
<dxm:PieChartDataAdapter.AttributeMappings>
<dxm:MapItemAttributeMapping Member="Name"
Name="Name"/>
</dxm:PieChartDataAdapter.AttributeMappings>
<dxm:PieChartDataAdapter.MeasureRules>
<dxm:MeasureRules RangeStops="1 10 20 30 40"/>
</dxm:PieChartDataAdapter.MeasureRules>
<dxm:PieChartDataAdapter.Mappings>
<dxm:MapPieMappingInfo
Longitude="CapitalLon"
Latitude="CapitalLat"
SegmentValue="Quantity"
SegmentId="MedalClass"/>
</dxm:PieChartDataAdapter.Mappings>
</dxm:PieChartDataAdapter>
</dxm:VectorLayer>
Step 4. Customize a Colorizer
In this step a colorizer will be customized. To do this, do the following.
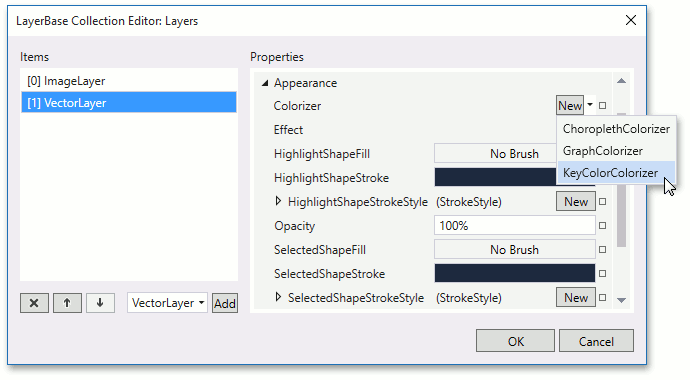
Assign a KeyColorColorizer object to the VectorLayer.Colorizer property
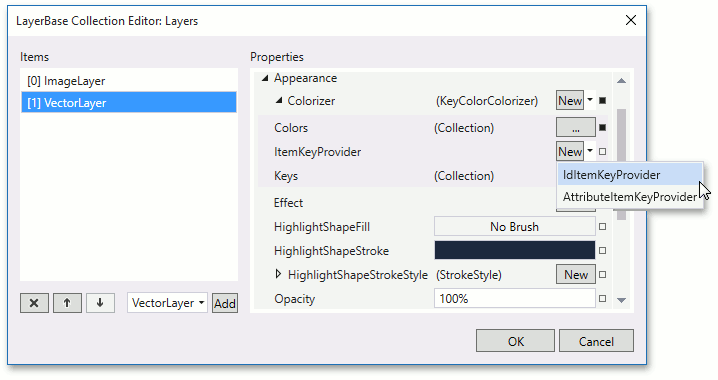
Specify the KeyColorColorizer.ItemKeyProvider property as IdItemKeyProvider.
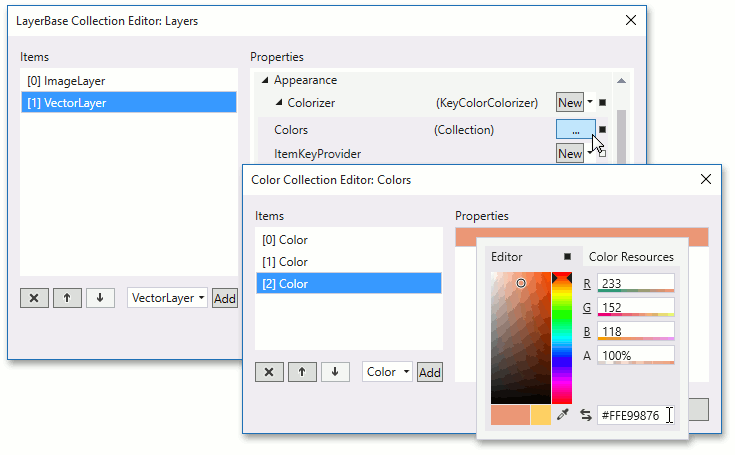
Add the following Color objects to the MapColorizer.Colors collection, as follows.
- 255, 207, 98 (#FFFFCF62)
- 169, 181, 188 (#FFA9B5BC)
- 233, 152, 118 (#FFE99876)
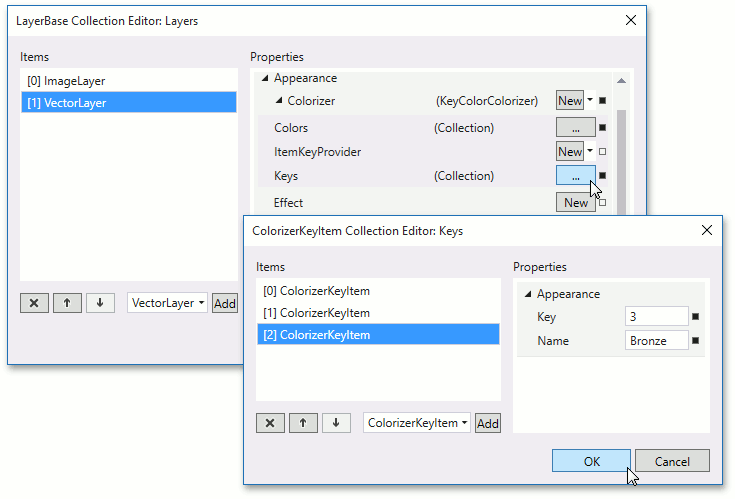
Add the following key-name pairs to the KeyColorColorizer.Keys property. Note that the key type should be Int32.
- 1 - Gold
- 2 - Silver
- 3 - Bronze
The colorizer’s XAML is below.
<dxm:VectorLayer>
    <!-- DataAdapter is here-->
    <dxm:VectorLayer.Colorizer>
        <dxm:KeyColorColorizer>
            <dxm:KeyColorColorizer.ItemKeyProvider>
                <dxm:IdItemKeyProvider/>
            </dxm:KeyColorColorizer.ItemKeyProvider>
            <dxm:KeyColorColorizer.Colors>
                <Color>#FFFFCF62</Color>
                <Color>#FFA9B5BC</Color>
                <Color>#FFE99876</Color>
            </dxm:KeyColorColorizer.Colors>
            <dxm:KeyColorColorizer.Keys>
                <dxm:ColorizerKeyItem Name="Gold">
                    <dxm:ColorizerKeyItem.Key>
                        <sys:Int32>1</sys:Int32>
                    </dxm:ColorizerKeyItem.Key>
                </dxm:ColorizerKeyItem>
                <dxm:ColorizerKeyItem Name="Silver">
                    <dxm:ColorizerKeyItem.Key>
                        <sys:Int32>2</sys:Int32>
                    </dxm:ColorizerKeyItem.Key>
                </dxm:ColorizerKeyItem>
                <dxm:ColorizerKeyItem Name="Bronze">
                    <dxm:ColorizerKeyItem.Key>
                        <sys:Int32>3</sys:Int32>
                     </dxm:ColorizerKeyItem.Key>
                 </dxm:ColorizerKeyItem>
            </dxm:KeyColorColorizer.Keys>
        </dxm:KeyColorColorizer>
    </dxm:VectorLayer.Colorizer>
</dxm:VectorLayer>
If the application is launched now, it should look like this.
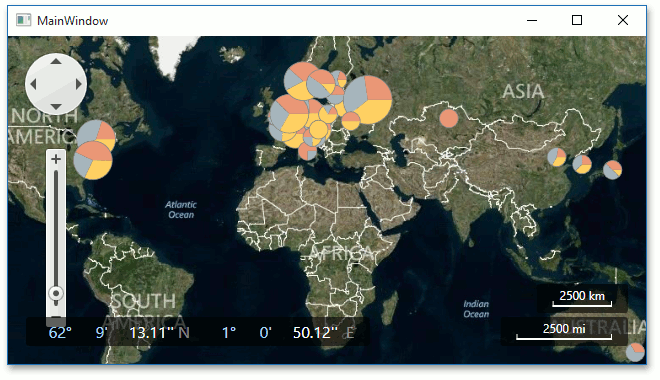
Let us add color and size legends to the application to explain the colors and sizes of the pie charts.
Step 5. Adding Legends
To add legends to the application, do the following.
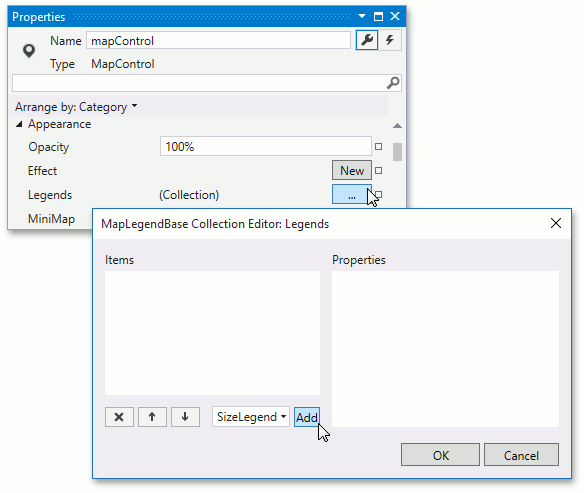
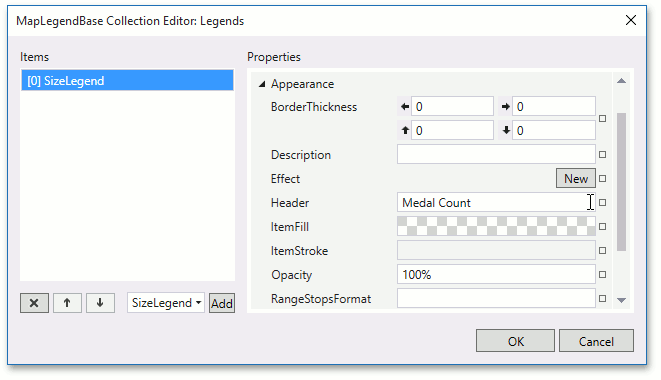
Locate the MapControl.Legends property in the Properties window and click the ellipsis button. In the invoked Legends Editor, choose SizeLegend and click the Add button.
Set the MapLegendBase.Header property to Medal Clount.
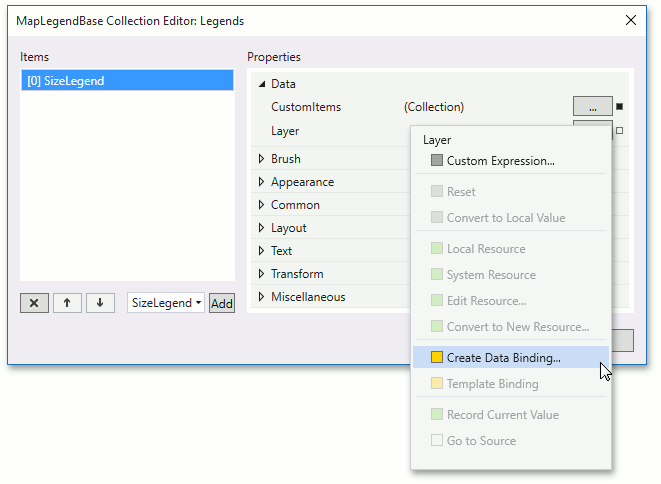
Bind the vector layer to the ItemsLayerLegend.Layer property. To do this, click the property marker and in the invoked list select Create Data Binding….
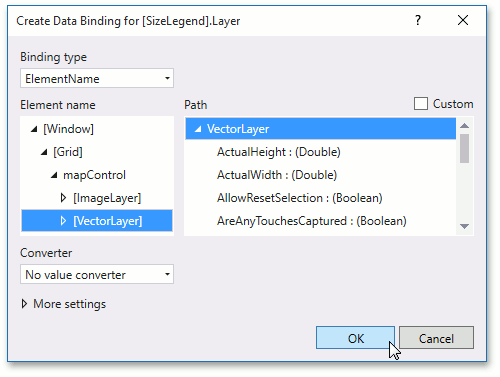
In the invoked editor, select the layer and click OK.
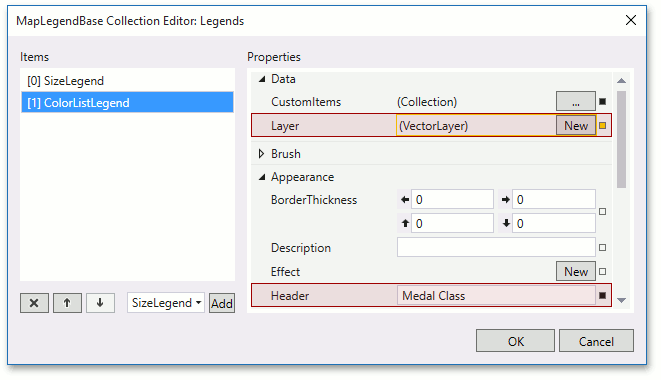
Repeat the three previous steps to add a ColorListLegend with the Medal Class header.
The XAML below shows how this can be done.
<dxm:MapControl CenterPoint="40,10" ZoomLevel="2" ToolTipEnabled="True">
<dxm:MapControl.Legends>
    <dxm:SizeLegend Header="Medal Count" Layer="{Binding ElementName=vectorLayer, Mode=OneWay}"/>
    <dxm:ColorListLegend Header="Medal Class" Layer="{Binding ElementName=vectorLayer, Mode=OneWay}"/>
</dxm:MapControl.Legends>
<!-- -->
<dxm:VectorLayer x:Name="vectorLayer">
    <!-- -->
</dxm:VectorLayer>
Result
The full XAML should look like follows.
Note
A complete sample project is available at https://github.com/DevExpress-Examples/wpf-mapcontrol-getting-started-lesson-3-add-analytical-data-to-a-geographical-map-t177876.
<Window
xmlns="http://schemas.microsoft.com/winfx/2006/xaml/presentation"
xmlns:x="http://schemas.microsoft.com/winfx/2006/xaml"
xmlns:sys="clr-namespace:System;assembly=mscorlib"
xmlns:dxm="http://schemas.devexpress.com/winfx/2008/xaml/map"
x:Class="Wpf_MapControl_Lesson3.MainWindow"
Title="MainWindow" Height="350" Width="525">
<Window.Resources>
<XmlDataProvider x:Key="dataProvider" Source="sochi2014.xml" XPath="/NewDataSet"/>
</Window.Resources>
<Grid>
<dxm:MapControl CenterPoint="40,10" ZoomLevel="2" ToolTipEnabled="True">
<!--region #Legends-->
<dxm:MapControl.Legends>
<dxm:SizeLegend Header="Medal Count" Layer="{Binding ElementName=vectorLayer}"/>
<dxm:ColorListLegend Header="Medal Class" Layer="{Binding ElementName=vectorLayer}"/>
</dxm:MapControl.Legends>
<!--endregion #Legends-->
<dxm:ImageTilesLayer>
<dxm:ImageTilesLayer.DataProvider>
<dxm:BingMapDataProvider BingKey="YOUR BING KEY"/>
</dxm:ImageTilesLayer.DataProvider>
</dxm:ImageTilesLayer>
<dxm:VectorLayer x:Name="vectorLayer"
ToolTipPattern="{}{Name} Gold: %V0% Silver: %V1% Bronze: %V2% Total: %V%">
<!--region #PieGeneration-->
<dxm:VectorLayer.Data>
<dxm:PieChartDataAdapter DataSource="{Binding Source={StaticResource dataProvider}, XPath=Table1}"
ItemIdDataMember="Country" ItemMinSize="20" ItemMaxSize="60">
<dxm:PieChartDataAdapter.MeasureRules>
<dxm:MeasureRules RangeStops="1 10 20 30 40"/>
</dxm:PieChartDataAdapter.MeasureRules>
<dxm:PieChartDataAdapter.AttributeMappings>
<dxm:MapItemAttributeMapping Member="Name" Name="Name"/>
</dxm:PieChartDataAdapter.AttributeMappings>
<dxm:PieChartDataAdapter.Mappings>
<dxm:MapPieMappingInfo Latitude="CapitalLat" Longitude="CapitalLon"
SegmentId="MedalClass" SegmentValue="Quantity"/>
</dxm:PieChartDataAdapter.Mappings>
</dxm:PieChartDataAdapter>
</dxm:VectorLayer.Data>
<!--endregion #PieGeneration-->
<!--region #ColorizerAdding-->
<dxm:VectorLayer.Colorizer>
<dxm:KeyColorColorizer>
<dxm:KeyColorColorizer.ItemKeyProvider>
<dxm:IdItemKeyProvider/>
</dxm:KeyColorColorizer.ItemKeyProvider>
<dxm:KeyColorColorizer.Colors>
<Color>#FFFFCF62</Color>
<Color>#FFA9B5BC</Color>
<Color>#FFE99876</Color>
</dxm:KeyColorColorizer.Colors>
<dxm:KeyColorColorizer.Keys>
<dxm:ColorizerKeyItem Name="Gold">
<dxm:ColorizerKeyItem.Key>
<sys:Int32>1</sys:Int32>
</dxm:ColorizerKeyItem.Key>
</dxm:ColorizerKeyItem>
<dxm:ColorizerKeyItem Name="Silver">
<dxm:ColorizerKeyItem.Key>
<sys:Int32>2</sys:Int32>
</dxm:ColorizerKeyItem.Key>
</dxm:ColorizerKeyItem>
<dxm:ColorizerKeyItem Name="Bronze">
<dxm:ColorizerKeyItem.Key>
<sys:Int32>3</sys:Int32>
</dxm:ColorizerKeyItem.Key>
</dxm:ColorizerKeyItem>
</dxm:KeyColorColorizer.Keys>
</dxm:KeyColorColorizer>
<!--endregion #ColorizerAdding-->
</dxm:VectorLayer.Colorizer>
</dxm:VectorLayer>
</dxm:MapControl>
</Grid>
</Window>
Run the application to see the result.