Lesson 2 - Create a Chart Using the Designer
- 3 minutes to read
This tutorial demonstrates the Chart Designer that allows you and your end-users to customize or create a chart from scratch. This lesson demonstrates the steps required to create a simple unbound chart using the designer.
- Step 1. Create a New Project and Run Chart Designer
- Step 2. Add Series to the Chart
- Step 3. Customize the Chart
- Result
Step 1. Create a New Project and Run the Chart Designer
- Run Microsoft® Visual Studio® 2012, 2013, 2015, 2017 or 2019.
- Create a new WPF Application project.
- Add the ChartControl component to your project, as you did in Lesson 1 (see step 1).
Click the ChartControl’s smart tag, and in its actions list, select the Run Designer link.
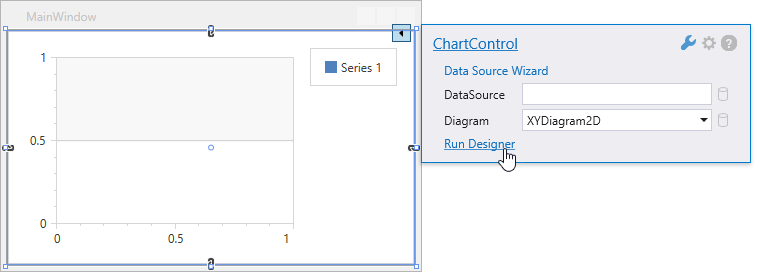
This invokes the Chart Designer.
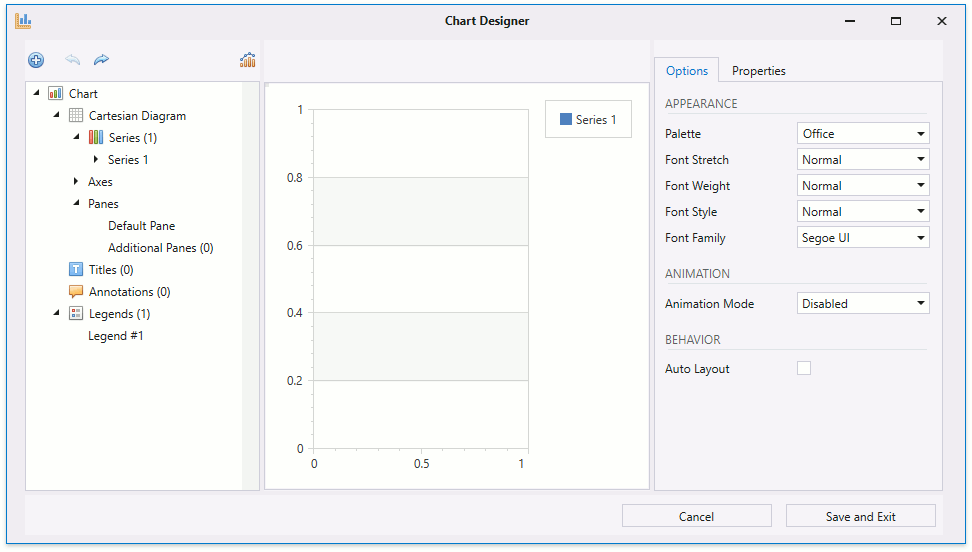
You can see the Side-by-Side Bar series (Series 1) in the Chart Elements Tree section. Note that Series 1 does not have series points.
Step 2. Add Series to the Chart
In this section, you add the second series to the chart and populate both series with points.
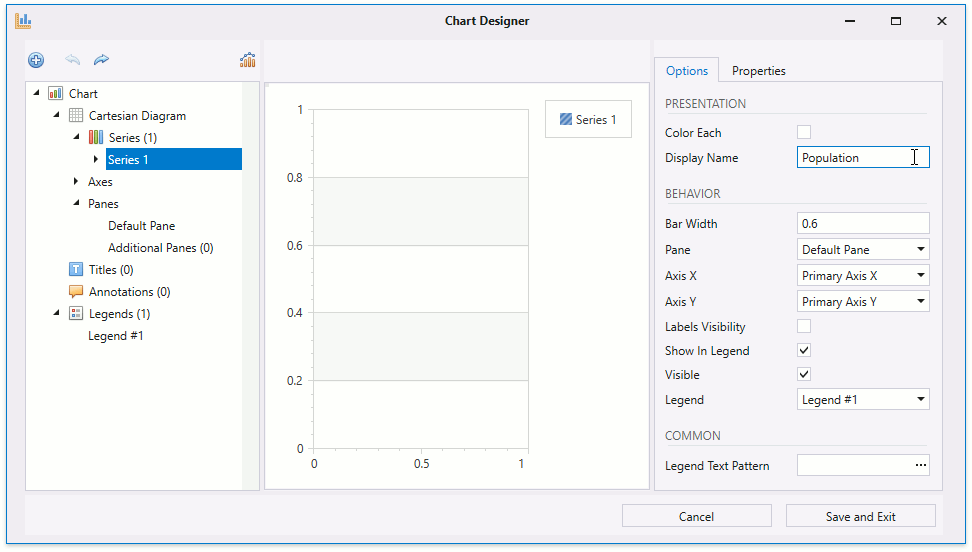
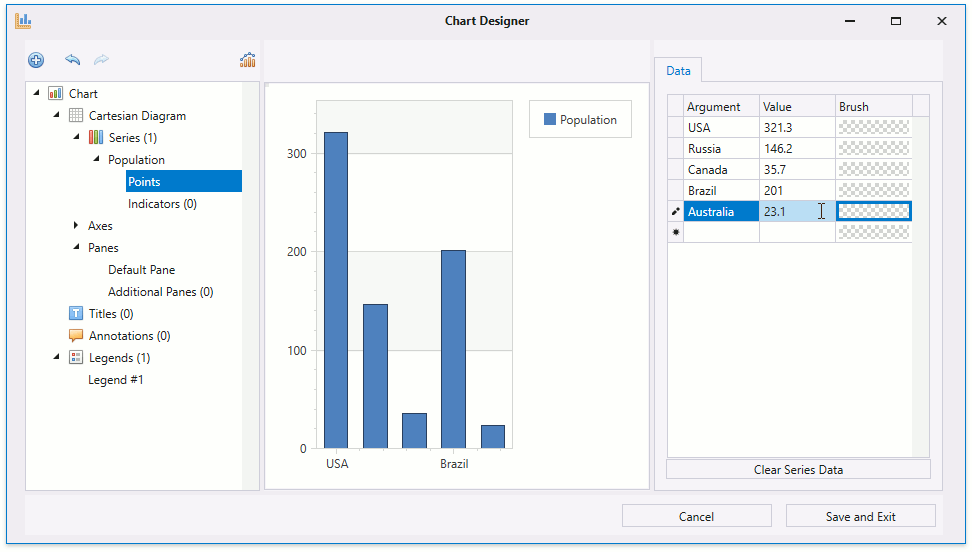
Select Series 1 in the tree and, in the Options tab, specify Population as the series’s display name.
- Expand the Population series options using the expand button and select the Points item.
In the Data tab, populate Argument and Value columns with data as follows:
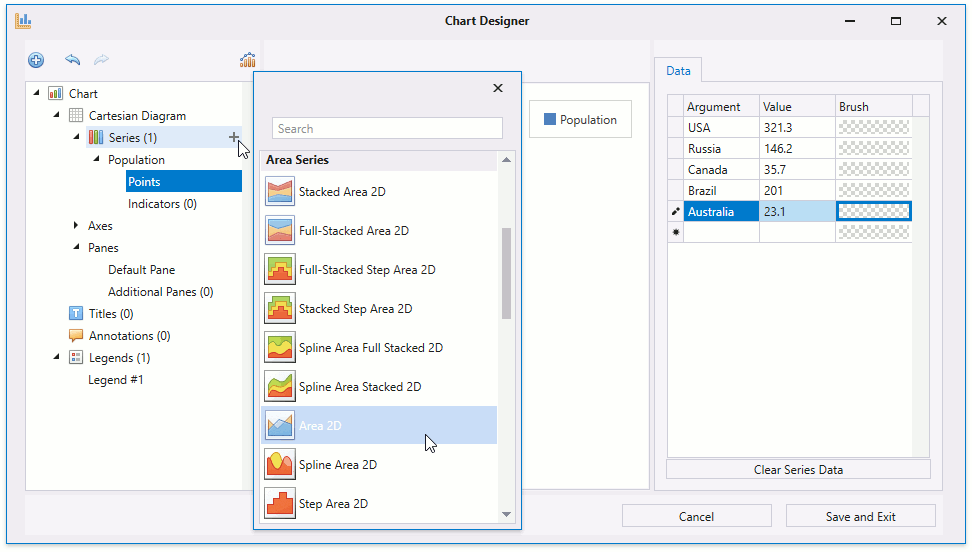
Then, add the second series to the diagram (for example, the Area series). For this, do the following:
Click the Series item’s Add button in the Elements Tree. In the invoked dialog, click the Area 2D series type. This adds the Area series (Series 2) to the chart with randomly generated data. Note that the arguments’ axis scale type is defined based on the first series’s qualitative data. The second series is hidden because it has numeric arguments.
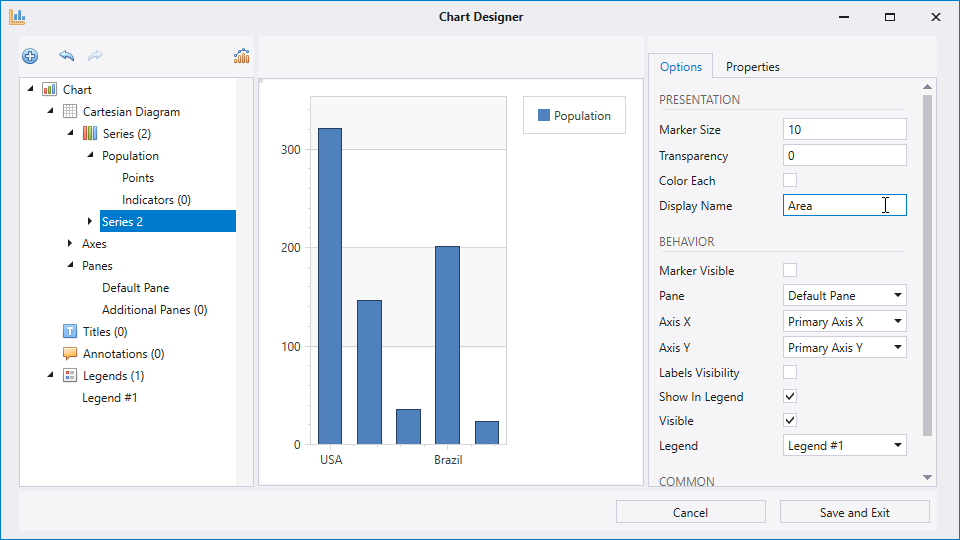
Specify the second series’s display name as Area.
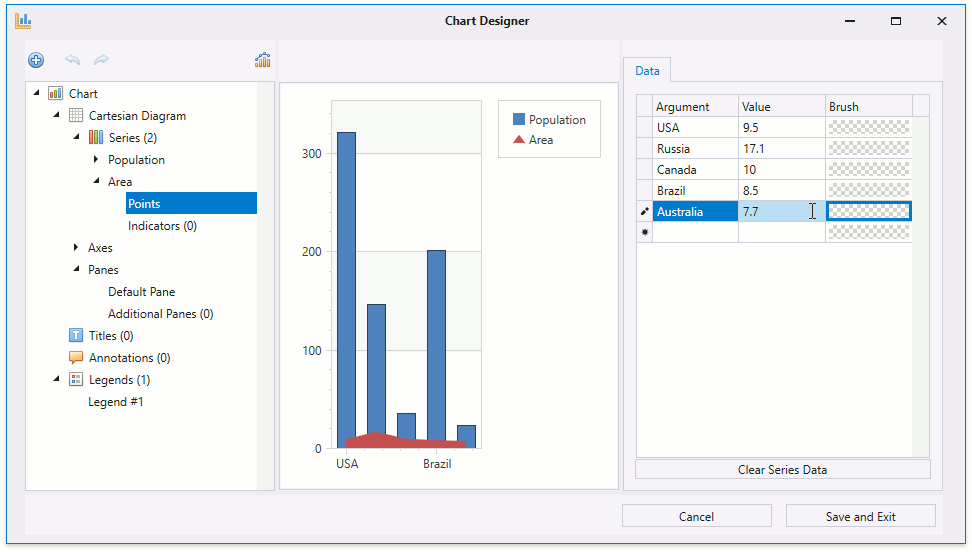
Click the Clear Series Data button to clear automatically generated data.
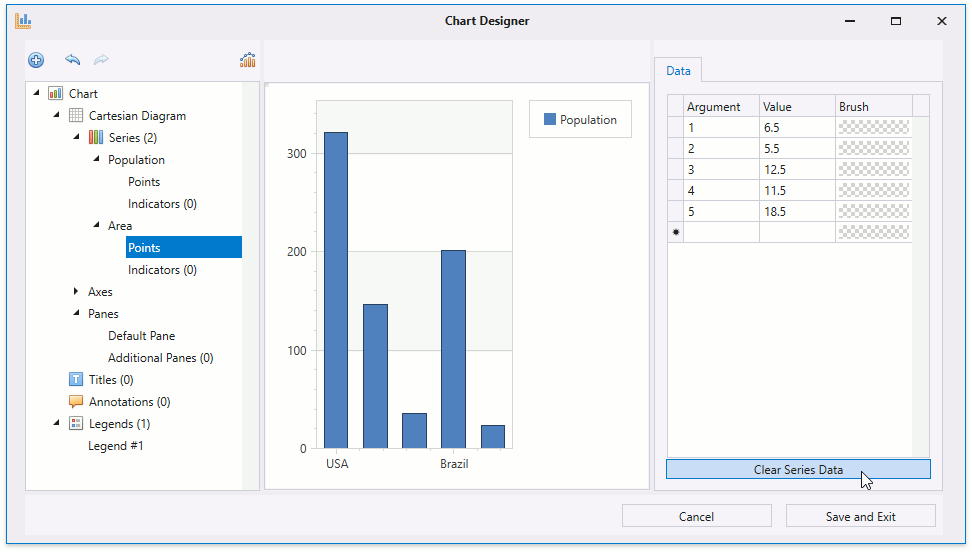
Then, define the Area series points’ data as follows:
Step 3. Customize the Chart
This section provides the steps allowing you to customize your chart’s appearance.
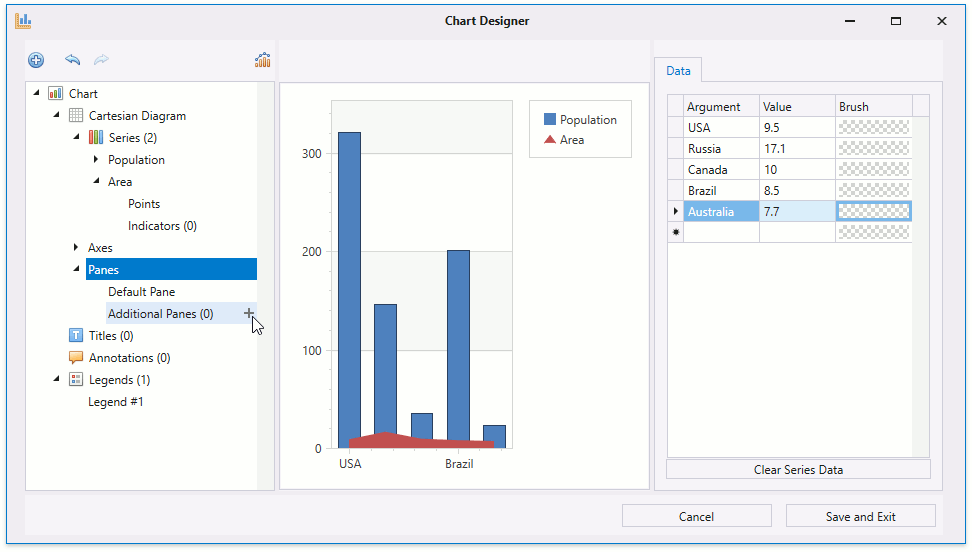
Displaying Series in Separate Panes
The following steps show how to display each series in a separate pane:
Expand the Panes item. Click the Additional Panes item’s Add button to create a new pane.
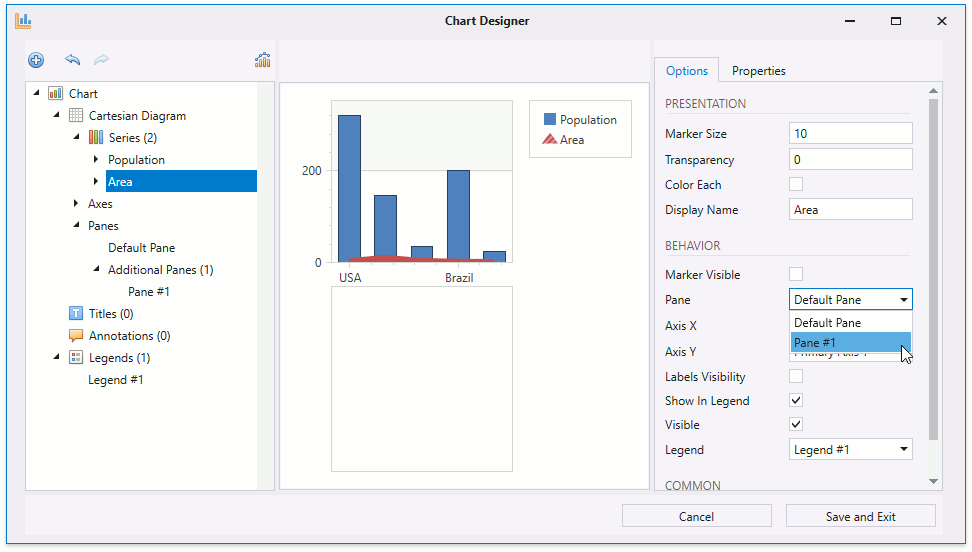
Select the Area series in the Elements Tree. In the Options tab, locate the Pane option, and in its drop-down list, select the Pane #1 item.
Adding a Secondary Axis
You can add and customize a secondary axis by performing the steps below:
Expand the Axes item. Click the Secondary Axes Y item’s Add button to add a secondary y-axis.
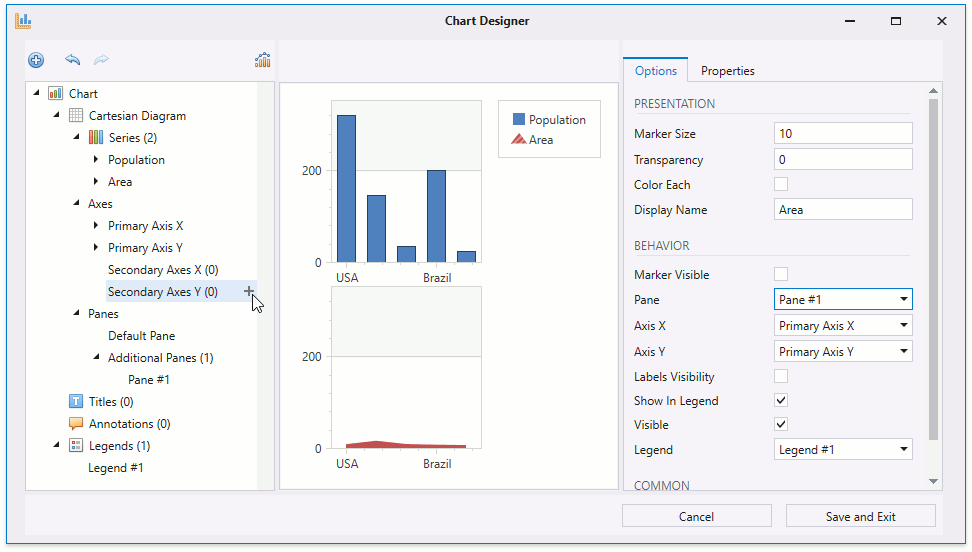
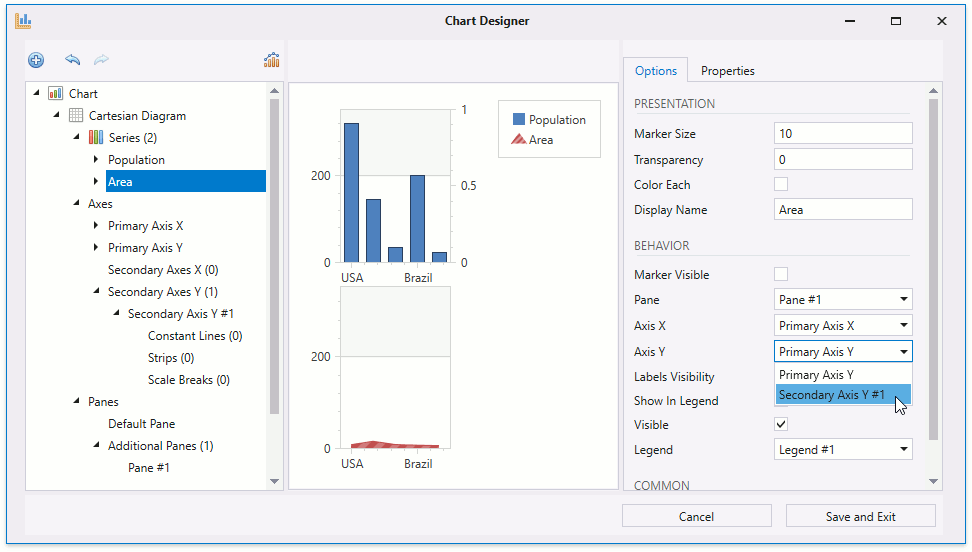
Select the Area series. In the Options tab, set the Axis Y option to Secondary Axis Y #1 using the option’s drop-down list.
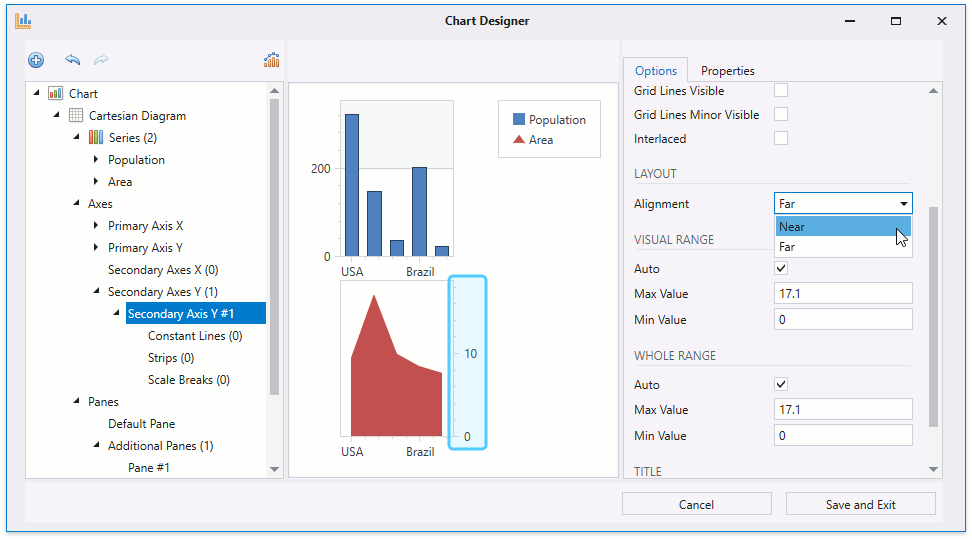
Select the Secondary Axis Y #1 in the Elements Tree. Then, set the axis’s Alignment option to Near.
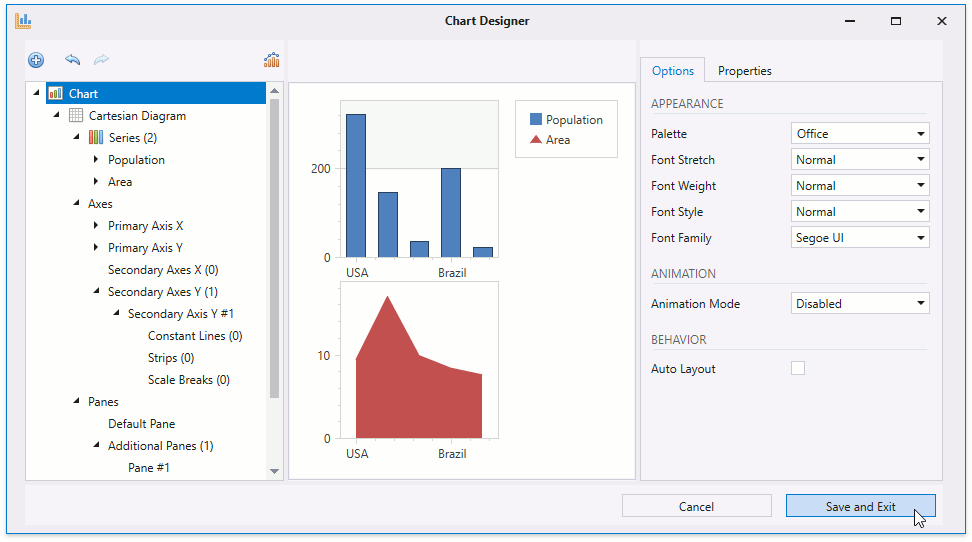
The following image displays the results. Click the Save and Exit button to apply all the changes and close the designer.
Result
The following snippet shows the resulting markup:
<Window xmlns="http://schemas.microsoft.com/winfx/2006/xaml/presentation"
        xmlns:x="http://schemas.microsoft.com/winfx/2006/xaml"
        xmlns:d="http://schemas.microsoft.com/expression/blend/2008"
        xmlns:mc="http://schemas.openxmlformats.org/markup-compatibility/2006"
        xmlns:local="clr-namespace:Lesson2"
        xmlns:dxc="http://schemas.devexpress.com/winfx/2008/xaml/charts"
        x:Class="Lesson2.MainWindow"
        mc:Ignorable="d"
        Title="MainWindow" Height="405" Width="720">
    <Grid>
        <dxc:ChartControl>
            <dxc:ChartControl.Legends>
                <dxc:Legend/>
            </dxc:ChartControl.Legends>
            <dxc:XYDiagram2D PaneOrientation="Vertical">
                <dxc:XYDiagram2D.SecondaryAxesY>
                    <dxc:SecondaryAxisY2D x:Name="axisy0" Alignment="Near"/>
                </dxc:XYDiagram2D.SecondaryAxesY>
                <dxc:XYDiagram2D.DefaultPane>
                    <dxc:Pane x:Name="pane"/>
                </dxc:XYDiagram2D.DefaultPane>
                <dxc:XYDiagram2D.Panes>
                    <dxc:Pane x:Name="pane0"/>
                </dxc:XYDiagram2D.Panes>
                <dxc:BarSideBySideSeries2D DisplayName="Population">
                    <dxc:SeriesPoint Argument="USA" Value="321.3"/>
                    <dxc:SeriesPoint Argument="Russia" Value="146.2"/>
                    <dxc:SeriesPoint Argument="Canada" Value="35.7"/>
                    <dxc:SeriesPoint Argument="Brazil" Value="201"/>
                    <dxc:SeriesPoint Argument="Australia" Value="23.1"/>
                </dxc:BarSideBySideSeries2D>
                <dxc:AreaSeries2D DisplayName="Area"
                                  dxc:XYDiagram2D.SeriesPane="{Binding ElementName=pane0}"
                                  dxc:XYDiagram2D.SeriesAxisY="{Binding ElementName=axisy0}">
                    <dxc:SeriesPoint Argument="USA" Value="9.5"/>
                    <dxc:SeriesPoint Argument="Russia" Value="17.1"/>
                    <dxc:SeriesPoint Argument="Canada" Value="10"/>
                    <dxc:SeriesPoint Argument="Brazil" Value="8.5"/>
                    <dxc:SeriesPoint Argument="Australia" Value="7.7"/>
                </dxc:AreaSeries2D>
            </dxc:XYDiagram2D>
        </dxc:ChartControl>
    </Grid>
</Window>
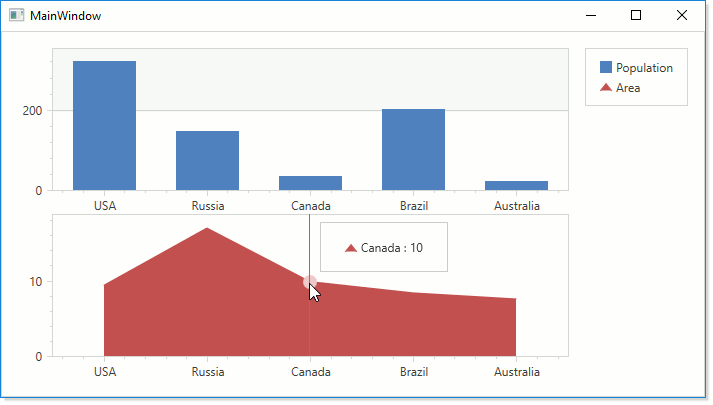
Run the application. The following image illustrates the resulting chart at runtime: