How to: Create a 2D Funnel Chart
- 3 minutes to read
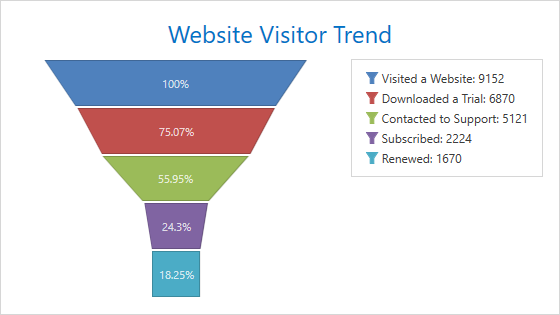
This example demonstrates how to create a 2D Funnel chart.
Create a ChartControl and set its ChartControl.Diagram property to a SimpleDiagram2D object.
Note
Note that the ChartControl.Diagram is a content property. You can declare a diagram in XAML directly after a chart control’s declaration without wrapping it in opening and closing ChartControl.Diagram tags.
Add a FunnelSeries2D object to the Diagram.Series collection.
Note
Note that the Diagram.Series is a content property. You can declare series in XAML directly after a diagram’s declaration without wrapping them in opening and closing Diagram.Series tags.
Use the following properties to bind the series to data:
- Series.DataSource - Specifies the series’s data source.
- Series.ArgumentDataMember - Defines the data member that provides the series’s arguments.
- Series.ValueDataMember - Specifies the data member that provides the series’s values.
Set the Series.LegendTextPattern property to “{}{A}: {V}” to show a point argument with a corresponding value for each point in the legend.
Enable the Series.LabelsVisibility property to display the series labels. Set the SeriesLabel.TextPattern property to “{}{VP:##.##%}” to show a point’s percentage value in each series label.
To change the funnel height’s ratio to its width, disable the FunnelSeries2D.HeightToWidthRatioAuto property and define FunnelSeries2D.HeightToWidthRatio.
You can optionally add a chart title and change the legend‘s position.
<Window
        xmlns="http://schemas.microsoft.com/winfx/2006/xaml/presentation"
        xmlns:x="http://schemas.microsoft.com/winfx/2006/xaml"
        xmlns:dxc="http://schemas.devexpress.com/winfx/2008/xaml/charts"
        xmlns:local="clr-namespace:FunnelChart"
        x:Class="FunnelChart.MainWindow"
        Title="MainWindow" Height="650" Width="900">
    <Window.DataContext>
        <local:ChartViewModel/>
    </Window.DataContext>
    <Grid>
        <dxc:ChartControl>
            <dxc:SimpleDiagram2D>
                <dxc:FunnelSeries2D DataSource="{Binding Data}"
                                    ArgumentDataMember="Argument"
                                    ValueDataMember="Value"
                                    LegendTextPattern="{}{A}: {V}"
                                    HeightToWidthRatioAuto="False"
                                    HeightToWidthRatio="0.9"
                                    PointDistance="2"
                                    LabelsVisibility="True">
                    <dxc:FunnelSeries2D.Label>
                        <dxc:SeriesLabel TextPattern="{}{VP:##.##%}"
                                         dxc:FunnelSeries2D.LabelPosition="Center"/>
                    </dxc:FunnelSeries2D.Label>
                </dxc:FunnelSeries2D>
            </dxc:SimpleDiagram2D>
            <dxc:ChartControl.Titles>
                <dxc:Title Content="Website Visitor Trend"
                           Dock="Top"
                           HorizontalAlignment="Center"/>
            </dxc:ChartControl.Titles>
            <dxc:ChartControl.Legends>
                <dxc:Legend HorizontalPosition="RightOutside"
                            VerticalPosition="Top"/>
            </dxc:ChartControl.Legends>
        </dxc:ChartControl>
    </Grid>
</Window>