Nested Donut
Short Description
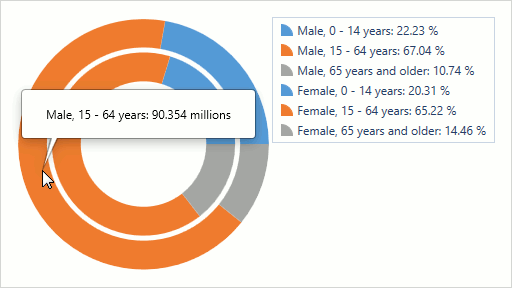
The Nested Donut view is similar to the Pie (Donut) series view, but instead of comparing different donut series side by side, you can compare one donut nested in another.
In the image below the Nested Donut chart shows the Age structure of the United States, Brazil and Russia population.
Series Characteristics
The table below lists the main characteristics of this chart type.
| Feature | Value |
|---|---|
| Series View type | NestedDonutSeries2D |
| Diagram type | SimpleDiagram2D |
| Number of arguments per series point | 1 |
| Number of values per series point | 1 |
For information on which series view types can be combined with the Nested Donut view, refer to the Series Type Compatibility document.
Example
The following example demonstrates how to create a 2D Nested Donut chart.