Data Aggregation
- 8 minutes to read
The Chart Control can use an aggregate function to group raw data source values and show aggregates as series points. You can use aggregation to show grouped data and decrease the number of visible points in a chart. Data aggregation is only available for argument axes (x-axes).
- Aggregation vs Summaries
- Aggregation Basics
- Aggregate Date-Time Data
- Aggregate Time-Span Data
- Aggregate Numeric Data
- Aggregate Qualitative Data
- Aggregate an Individual Series’s Data
- Create a Custom Aggregate Function
Aggregation vs Summaries
In addition to Aggregation, the Chart Control provides Summaries that also allow you to group raw data values.
| Aggregation | Summary | |
|---|---|---|
| Store Data | Chart stores raw data source values. | Chart stores summarized values. |
| Change Detail Level | Chart re-calculates data in memory. | Chart re-loads data from the data source. |
| Behave on Zoom | If the automatic scale options are used, Chart recalculates value aggregates when it is zoomed. | Chart does not re-calculate aggregated values when it is zoomed. |
| Memory Consumption | High | Low |
Aggregation Basics
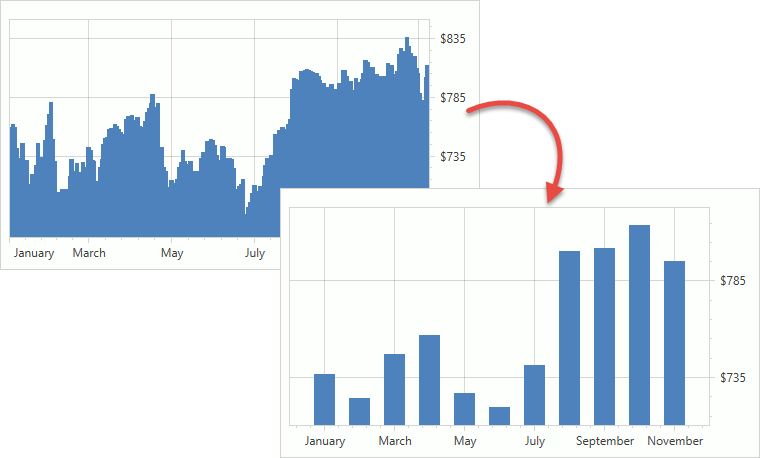
When the aggregation is enabled, the chart splits the x-axis into intervals (the x-axis measurement unit value defines the intervals), and uses an aggregate function to aggregate data for each interval.
The AggregateFunction enumeration lists the available aggregate functions:
- Average (a default function)
- Count
- Financial (Use it for financial series.)
- Histogram (See the Histogram topic for more information.)
- Maximum
- Minimum
- Sum
- Custom (Refer to the Create an Aggregate Function section for more information.)
Scale options assigned to the x-axis’s ~ScaleOptions property store aggregation-related settings. You can use the following option types:
Options | Description | How to use |
|---|---|---|
Automatic Date-Time, Automatic Time-Span, and Automatic Numeric | The chart control defines the optimal measurement unit for an axis based on the data set’s values, the Chart Control’s current size, and zoom level. | For date-time axes. Assign a
AutomaticDateTimeScaleOptions object to the AxisX2D.DateTimeScaleOptions, AxisX3D.DateTimeScaleOptions or RadarAxisX2D.DateTimeScaleOptions property. |
Manual Date-Time, Manual Time-Span, and Manual Numeric | You can use the MeasureUnit property to specify the axis measurement unit that defines how to divide an axis scale into intervals for aggregation. | For date-time axes. Assign a ManualDateTimeScaleOptions (or its descendant) object to the AxisX2D.DateTimeScaleOptions, AxisX3D.DateTimeScaleOptions or RadarAxisX2D.DateTimeScaleOptions property. |
Qualitative | Chart aggregates point values if points have equal arguments. | For qualitative axes. Assign QualitativeScaleOptions to the AxisX2D.QualitativeScaleOptions or AxisX3D.QualitativeScaleOptions property. |
Note
Axes that have the Continuous scale type (ContinuousDateTimeScaleOptions, ContinuousTimeSpanScaleOptions and ContinuousNumericScaleOptions) do not support aggregation.
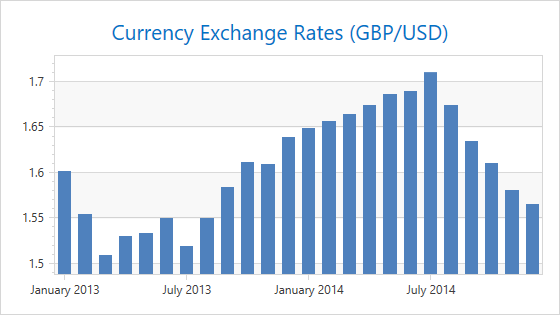
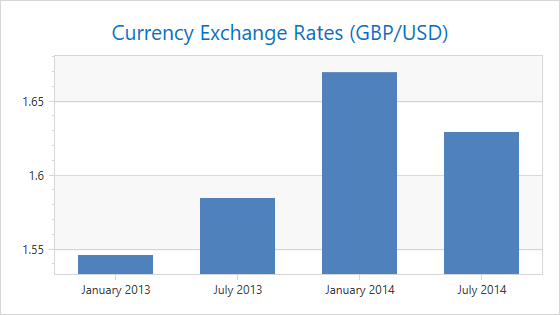
Aggregate Date-Time Data
The following images show aggregated date-time data:
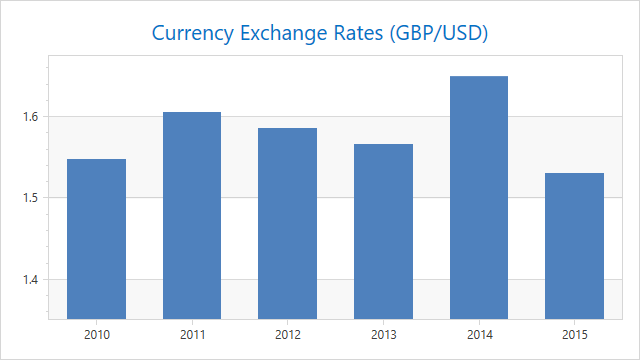
MeasureUnit = “Year”; GridAlignment = “Year”
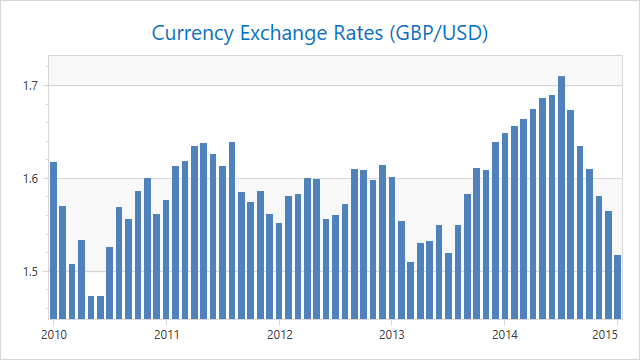
MeasureUnit = “Month”; GridAlignment = “Year”
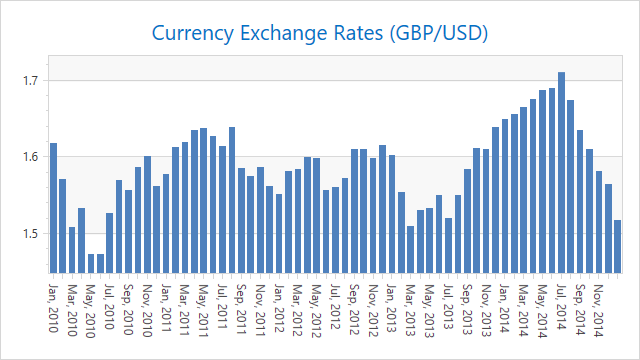
MeasureUnit = “Month”; GridAlignment = “Month”
The examples below use an Average function to aggregate date-time data:
Automatic Mode
<dxc:XYDiagram2D>
    <dxc:XYDiagram2D.AxisX>
        <dxc:AxisX2D>
            <dxc:AxisX2D.DateTimeScaleOptions>
                <dxc:AutomaticDateTimeScaleOptions AggregateFunction="Average"/>
            </dxc:AxisX2D.DateTimeScaleOptions>
        </dxc:AxisX2D>
    </dxc:XYDiagram2D.AxisX>
    <!--...-->
</dxc:XYDiagram2D>
Manual Mode
<dxc:XYDiagram2D>
    <dxc:XYDiagram2D.AxisX>
        <dxc:AxisX2D>
            <dxc:AxisX2D.DateTimeScaleOptions>
                <dxc:ManualDateTimeScaleOptions AggregateFunction="Average"
                                                MeasureUnit="Year"
                                                GridAlignment="Year"/>
            </dxc:AxisX2D.DateTimeScaleOptions>
        </dxc:AxisX2D>
    </dxc:XYDiagram2D.AxisX>
    <!--...-->
</dxc:XYDiagram2D>
The examples above use the following API members:
| Member | Description |
|---|---|
| AxisX2D.DateTimeScaleOptions | Provides access to the options that define the behavior of a date-time X-scale when its mode is manual, automatic or continuous. |
| AutomaticDateTimeScaleOptions | Contains settings for a date-time axis data when its scale mode is automatic. |
| ManualDateTimeScaleOptions | Contains settings for a date-time axis data when its scale mode is manual. |
See also the following examples:
- How to: Use Manual Date-Time Scale Options of an Axis
- How to: Use a Custom Measure Units in Automatic Date-Time Scale Mode
Form a Custom Measurement Unit
You can use the ManualDateTimeScaleOptions.MeasureUnit property with the ManualDateTimeScaleOptions.MeasureUnitMultiplier property to configure a custom measurement unit for time-span axes with a manual scale.
For instance, set the MeasureUnit to Month and the MeasureUnitMultiplier to 6 to specify a measurement unit of six months.
MeasureUnit = Month; MeasureUnitMultiplier = 1
MeasureUnit = Month; MeasureUnitMultiplier = 6
<dxc:XYDiagram2D>
    <dxc:XYDiagram2D.AxisX>
        <dxc:AxisX2D>
            <dxc:AxisX2D.DateTimeScaleOptions>
                <dxc:ManualDateTimeScaleOptions AggregateFunction="Average"
                                                GridAlignment="Year"
                                                MeasureUnit="Month"
                                                MeasureUnitMultiplier="6"/>
            </dxc:AxisX2D.DateTimeScaleOptions>
        </dxc:AxisX2D>
    </dxc:XYDiagram2D.AxisX>
</dxc:XYDiagram2D>
Aggregate Time-Span Data
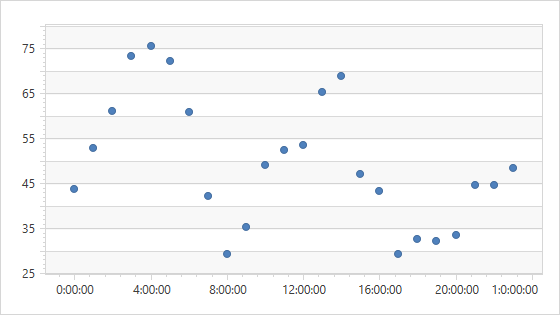
The following images show non-aggregated and aggregated time-span data:
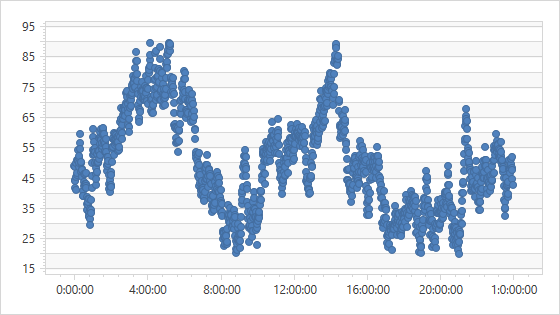
MeasureUnit = “Minute”; AggregateFunction = “None”
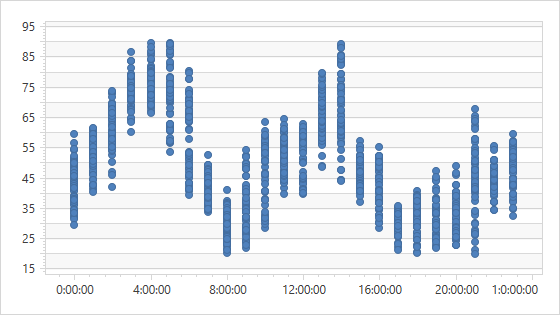
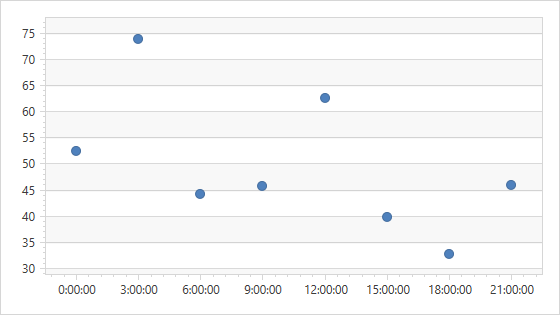
MeasureUnit = “Hour”; AggregateFunction = “None”
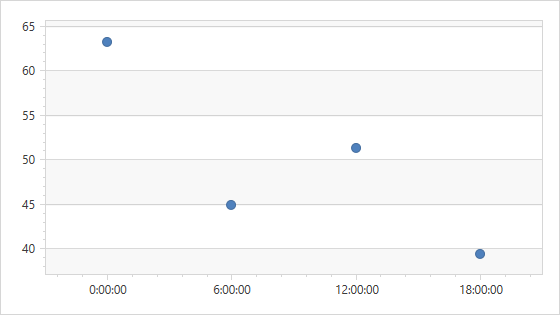
MeasureUnit = “Hour”; AggregateFunction = “Average”
The examples below use an Average function to aggregate time-span data:
Automatic Mode
<dxc:XYDiagram2D>
    <dxc:XYDiagram2D.AxisX>
        <dxc:AxisX2D>
            <dxc:AxisX2D.TimeSpanScaleOptions>
                <dxc:AutomaticTimeSpanScaleOptions AggregateFunction="Average"/>
            </dxc:AxisX2D.TimeSpanScaleOptions>
        </dxc:AxisX2D>
    </dxc:XYDiagram2D.AxisX>
</dxc:XYDiagram2D>
Manual Mode
<dxc:XYDiagram2D>
    <dxc:XYDiagram2D.AxisX>
        <dxc:AxisX2D>
            <dxc:AxisX2D.TimeSpanScaleOptions>
                <dxc:ManualTimeSpanScaleOptions MeasureUnit="Hour"
                                                AggregateFunction="Average"/>
            </dxc:AxisX2D.TimeSpanScaleOptions>
        </dxc:AxisX2D>
    </dxc:XYDiagram2D.AxisX>
</dxc:XYDiagram2D>
The examples above use the following API members:
| Member | Description |
|---|---|
| AxisX2D.TimeSpanScaleOptions | Gets or sets options of the time-span scale used by the argument axis. |
| AutomaticTimeSpanScaleOptions | Contains scale settings for an axis when its scale mode is automatic. |
| ManualTimeSpanScaleOptions | Contains settings for a time-span axis when its scale mode is manual. This scale mode allows you to specify a measurement unit. |
Form a Custom Measurement Unit
You can use the ManualTimeSpanScaleOptions.MeasureUnit property with the ManualTimeSpanScaleOptions.MeasureUnitMultiplier property to configure a custom measurement unit for time-span axes with a manual scale.
For instance, set the MeasureUnit to Hour and the MeasureUnitMultiplier to 3 to specify a measurement unit of three hours.
MeasureUnit = Hour; MeasureUnitMultiplier = 3
MeasureUnit = Hour; MeasureUnitMultiplier = 6
<dxc:XYDiagram2D.AxisX>
    <dxc:AxisX2D GridLinesVisible="False">
        <dxc:AxisX2D.TimeSpanScaleOptions>
            <dxc:ManualTimeSpanScaleOptions AutoGrid="False" AggregateFunction="Average"
                                            MeasureUnit="Hour" MeasureUnitMultiplier="3"
                                            GridSpacing="3" GridAlignment="Hour"/>
        </dxc:AxisX2D.TimeSpanScaleOptions>
    </dxc:AxisX2D>
</dxc:XYDiagram2D.AxisX>
Aggregate Numeric Data
The following images show aggregated numeric data:
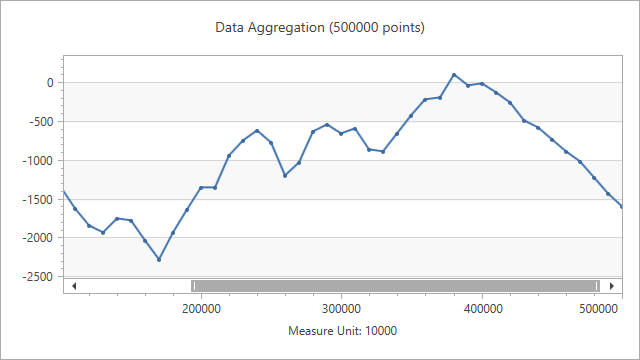
AggregationFunction = “Average”; MeasureUnit = “10000”
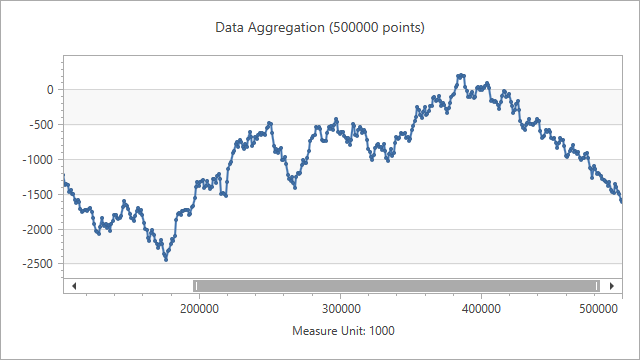
AggregationFunction = “Average”; MeasureUnit = “1000”
The examples below use an Average function to aggregate numeric data:
Automatic Mode
<dxc:XYDiagram2D>
    <dxc:XYDiagram2D.AxisX>
        <dxc:AxisX2D>
            <dxc:AxisX2D.NumericScaleOptions>
                <dxc:AutomaticNumericScaleOptions AggregateFunction="Average"/>
            </dxc:AxisX2D.NumericScaleOptions>
        </dxc:AxisX2D>
    </dxc:XYDiagram2D.AxisX>
</dxc:XYDiagram2D>
Manual Mode
<dxc:XYDiagram2D>
    <dxc:XYDiagram2D.AxisX>
        <dxc:AxisX2D>
            <dxc:AxisX2D.NumericScaleOptions>
                <dxc:ManualNumericScaleOptions AggregateFunction="Average"
                                               MeasureUnit="1000"/>
            </dxc:AxisX2D.NumericScaleOptions>
        </dxc:AxisX2D>
    </dxc:XYDiagram2D.AxisX>
</dxc:XYDiagram2D>
The examples above use the following API members:
| Member | Description |
|---|---|
| AxisX2D.NumericScaleOptions | Provides access to the options that define the behavior of a numeric X-scale when its mode is manual, automatic or continuous. |
| AutomaticNumericScaleOptions | Contains settings for a numeric axis data when its scale mode is automatic. |
| ManualNumericScaleOptions | Contains settings for a numeric axis data when its scale mode is manual. |
See also the following examples:
- How to: Use Manual Numeric Scale Options of an Axis
- How to: Use a Custom Measure Unit in Automatic Numeric Scale Mode
Aggregate Qualitative Data
The following images show non-aggregated and aggregated qualitative data:
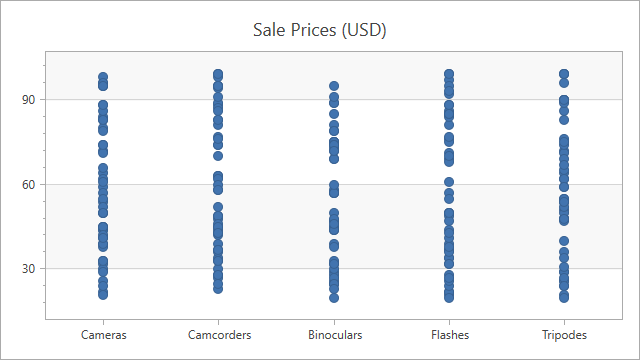
AggregationFunction = “None”
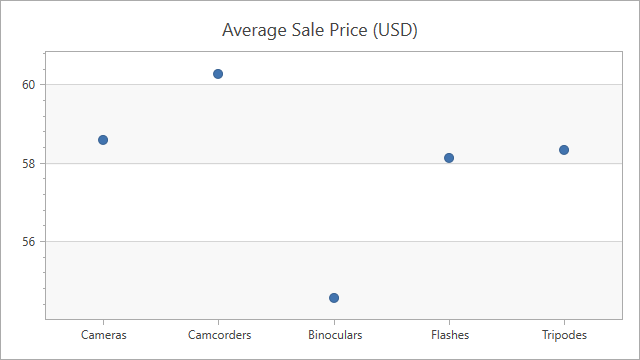
AggregationFunction = “Average”
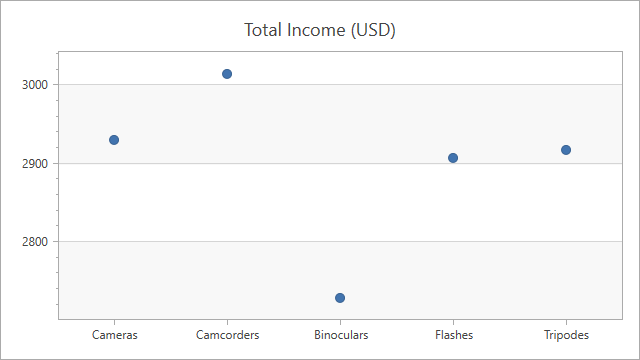
AggregationFunction = “Sum”
The example below uses a Sum function to aggregate qualitative data:
<dxc:XYDiagram2D>
    <dxc:XYDiagram2D.AxisX>
        <dxc:AxisX2D>
            <dxc:AxisX2D.QualitativeScaleOptions>
                <dxc:QualitativeScaleOptions AggregateFunction="Sum"/>
            </dxc:AxisX2D.QualitativeScaleOptions>
        </dxc:AxisX2D>
    </dxc:XYDiagram2D.AxisX>
</dxc:XYDiagram2D>
Aggregate an Individual Series’s Data
You can apply different aggregate functions to series that are bound to the same x-axis. In this case, the aggregate function applied to a series has higher priority than the axis’s aggregate function. To specify a series’s aggregate function, use the XYSeries.AggregateFunction property.
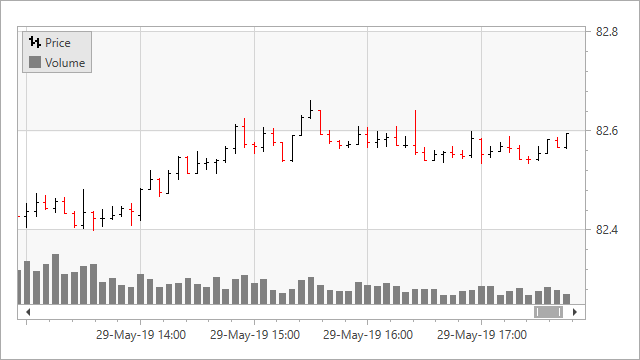
The following example uses the Financial function to aggregate the Stock series and the Sum function - the Bar series:
<dxc:XYDiagram2D>
    <dxc:StockSeries2D
        x:Name="stockSeries"
        DisplayName="Price"
        ArgumentDataMember="DateTimeStamp"
        OpenValueDataMember="Open"
        HighValueDataMember="High"
        LowValueDataMember="Low"
        CloseValueDataMember="Close"
        AggregateFunction="Financial">
    </dxc:StockSeries2D>
    <dxc:BarSideBySideSeries2D
        x:Name="volumeSeries"
        DisplayName="Volume"
        ArgumentDataMember="DateTimeStamp"
        ValueDataMember="Volume"
        AggregateFunction="Sum">
    </dxc:BarSideBySideSeries2D>
</dxc:XYDiagram2D>
Create a Custom Aggregate Function
Set the AggregateFunction (AutomaticDateTimeScaleOptions.AggregateFunction, ManualDateTimeScaleOptions.AggregateFunction, AutomaticNumericScaleOptions.AggregateFunction, ManualNumericScaleOptions.AggregateFunction, QualitativeScaleOptions.AggregateFunction or XYSeries.AggregateFunction) property to Custom.
Create a class that inherits the CustomAggregateFunction class.
Override the CustomAggregateFunction.Calculate(GroupInfo) method.
Initialize the CustomAggregateFunction (AutomaticDateTimeScaleOptions.CustomAggregateFunction, ManualDateTimeScaleOptions.CustomAggregateFunction, AutomaticNumericScaleOptions.CustomAggregateFunction, ManualNumericScaleOptions.CustomAggregateFunction, QualitativeScaleOptions.CustomAggregateFunction or XYSeries.CustomAggregateFunction) property with a newly created aggregate function class instance.
The example below shows how to implement an aggregate function:
<dxc:XYDiagram2D>
    <dxc:XYDiagram2D.AxisX>
        <dxc:AxisX2D>
            <dxc:AxisX2D.DateTimeScaleOptions>
                <dxc:AutomaticDateTimeScaleOptions AggregateFunction="Custom">
                    <dxc:AutomaticDateTimeScaleOptions.CustomAggregateFunction>
                        <local:StandardDeviationAggregateFunction/>
                    </dxc:AutomaticDateTimeScaleOptions.CustomAggregateFunction>
                </dxc:AutomaticDateTimeScaleOptions>
            </dxc:AxisX2D.DateTimeScaleOptions>
            <!--...-->
        </dxc:AxisX2D>
    </dxc:XYDiagram2D.AxisX>
    <!--...-->
</dxc:XYDiagram2D>