Trend Lines
A Trend Line is an indicator presented by a line drawn through two data points of a series.
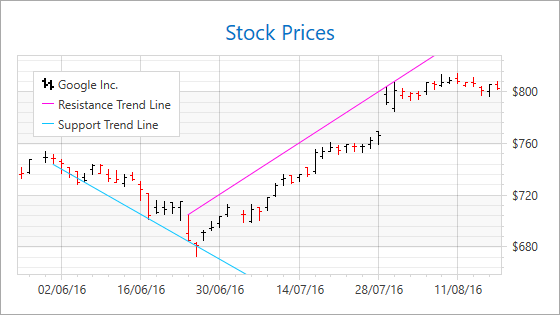
How to Add a Trend Line to a Chart
The following markup shows how to add two trend lines to a chart:
<dxc:StockSeries2D.Indicators>
    <dxc:TrendLine x:Name="trendLine1"
                Argument1="6/26/2016"
                ValueLevel1="High"
                Argument2="7/31/2016"
                ValueLevel2="High"
                ExtrapolateToInfinity="False"
                LegendText="Resistance Trend Line"
                ShowInLegend="True"/>
    <dxc:TrendLine x:Name="trendLine2"
                Argument1="6/1/2016"
                ValueLevel1="Low"
                Argument2="6/26/2016"
                ValueLevel2="Low"
                LegendText="Support Trend Line"
                ShowInLegend="True"/>
</dxc:StockSeries2D.Indicators>
The table lists classes and properties required to draw trend lines:
| Class or Property | Description |
|---|---|
| XYSeries2D.Indicators | The series collection of indicators. |
| TrendLine | A trend line. |
| FinancialIndicator.Argument1 | The argument of the first point. |
| FinancialIndicator.ValueLevel1 | The value level of the first point. |
| FinancialIndicator.Argument2 | The argument of the second point. |
| FinancialIndicator.ValueLevel2 | The value level of the second point. |
| TrendLine.ExtrapolateToInfinity | Specifies whether the trend line is extrapolated to infinity. |
| Indicator.LegendText | Text that is displayed with an indicator’s marker in a legend. |
| Indicator.ShowInLegend | Specifies whether an indicator is represented in a legend. |
Tip
Set the Indicator.Visible property to false when you need to hide a trend line on a chart without its removal from the Indicators collection.
Note
To learn more about the common indicator settings, examine the Indicators help document.
See Also