Top N and Others
- 2 minutes to read
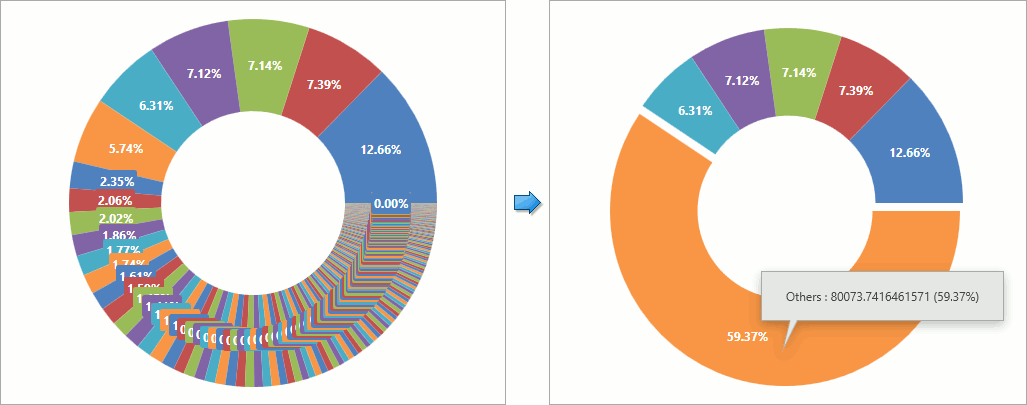
The “Top N” feature allows you to reduce the data point count by grouping points that do not belong to “Top N” values into an “Others” point.
This feature applies to data sets that have qualitative argument values. You can use series with the Pie (Donut) or Bar series view to visualize these data sets.
Important
In case of stacked bars each series selects its top values only by this series’s values, not by total value of all series.
Use the following markup to configure the “Top N” feature:
<dxc:PieSeries2D ArgumentDataMember="Name"
                 ValueDataMember="Area"
                 LegendTextPattern="{}{A}"
                 LabelsVisibility="True">
    <dxc:PieSeries2D.TopNOptions>
        <dxc:CountTopNOptions Count="5"
                              ShowOthers="True"
                              OthersArgument="Others"
                              dxc:PieSeries.OthersPointExplodedDistance="0.05"/>
    </dxc:PieSeries2D.TopNOptions>
</dxc:PieSeries2D>
The code above uses the following properties:
| Property | Description |
|---|---|
| Series.TopNOptions | Gets or sets the Top N and Others series’ options. This is a dependency property. |
| CountTopNOptions | The “Top N and Others“ feature options that selects first N largest points. |
| CountTopNOptions.Count | Gets or sets the number of points with the largest values that the series should show. |
| TopNOptionsBase.ShowOthers | Gets or sets the value indicating whether a series should show the aggregated “Others” point. This is a dependency property. |
| TopNOptionsBase.OthersArgument | Gets or sets the value that the aggregated “Others” point uses as the point’s argument. This is a dependency property. |
| PieSeries.OthersPointExplodedDistance | Gets or sets the “Others” slice offset from the pie center. |
In addition to the Top N behavior that selects the first N items, the Chart Control provides other behaviors which select top values:
Note
All charts in the following table are based on the same dataset.
Description | Sample Image |
|---|---|
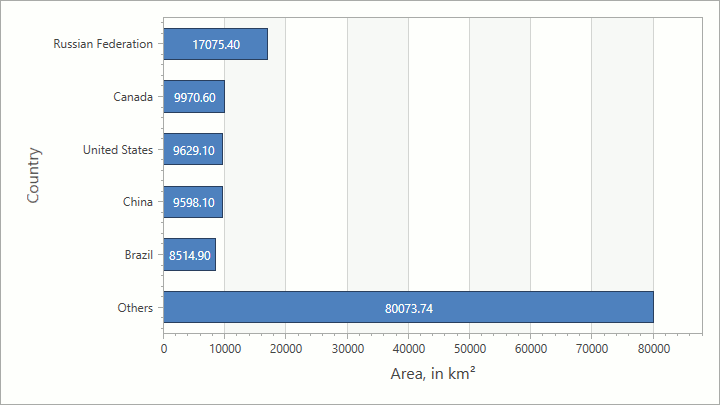
First Top N Points The CountTopNOptions class implements this behavior. It joins all points except the first N points with the largest values. For example, the following image demonstrates a bar chart with this behavior and the count set to 5: |
|
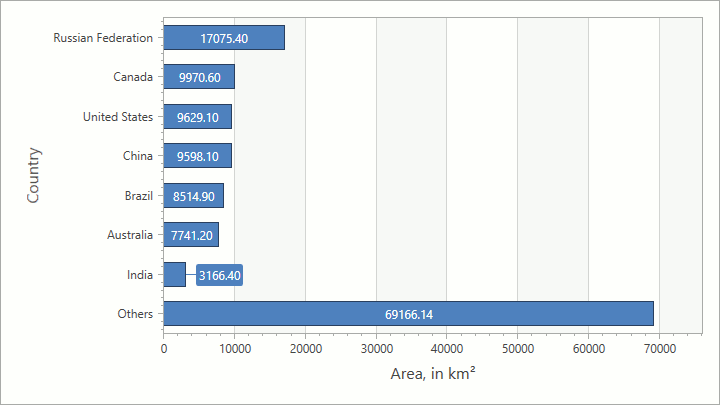
Top Points by Value The ValueTopNOptions class implements this behavior. It joins points whose values are smaller than the threshold value. For example, the following image demonstrates a bar chart with this behavior and the threshold value set to 3000: |
|
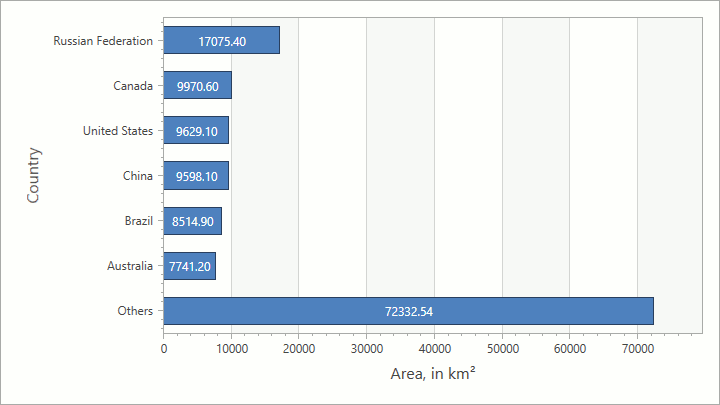
Top Points by Percentage Value The PercentageTopNOptions class implements this behavior. It joins points whose values are smaller than the threshold value as a percentage. For example, the following image demonstrates a bar chart with this behavior and the threshold value set to 5: |
|