Polar Point
Short Description
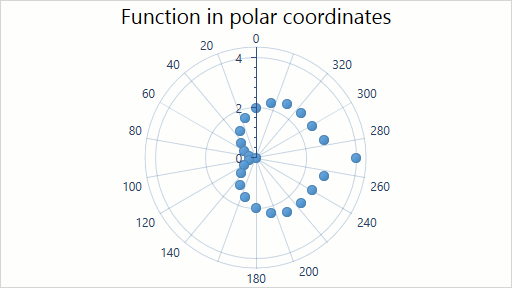
The Polar Point series is useful when it’s necessary to show points from one or more different series on the same circular diagram on the basis of angles. Note that although these charts normally have a circular shape, they can also be displayed as a polygon.
An example of the Polar Point chart is shown in the image below.
Series Characteristics
The table below lists the main characteristics of this chart type.
| Feature | Value |
|---|---|
| Series View type | PolarPointSeries2D |
| Diagram type | PolarDiagram2D |
| Number of arguments per series point | 1 |
| Number of values per series point | 1 |
For information on which series view types can be combined with the Polar Point view, refer to the Series Type Compatibility document.
Example
The following example demonstrates how to create a 2D Polar Point chart.