Lesson 3 - Create a 3D Chart with Automatically Generated Series
- 9 minutes to read
This tutorial will guide you through the steps needed to create 3D series automatically based on an underlying data source.
- Step 1. Prepare an Application
- Step 2. Add a Chart and Bind It to Data
- Step 3. Customize Chart Appearance
- Result
Step 1. Prepare an Application
In this step, you will add a data file to a project and design the Model and ViewModel classes.
Note
Note that this step can be skipped. To obtain a solution that is the result of the first step, download it from the DevExpress Support Center.
- Run Microsoft Visual Studio 2012, 2013, 2015, 2017 or 2019.
- Create a new WPF Application project.
- Add a new folder to the solution, name it Data.
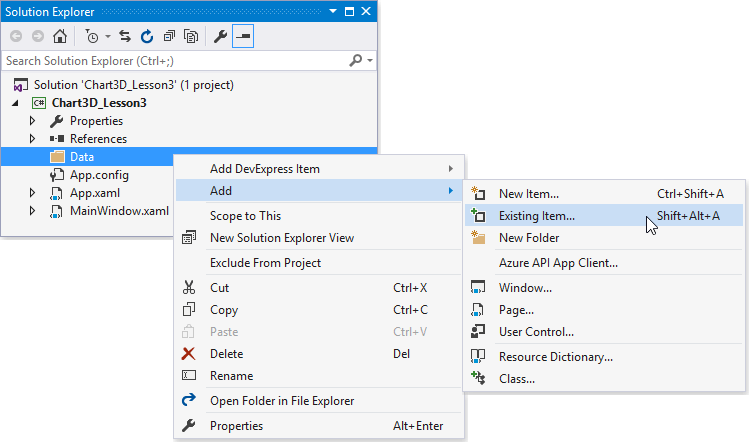
Add a data file to the newly created folder. To do this, right-click this folder and select the Add | Existing Item… element.
- In the invoked window, browse the IrisDataSet.xml file that is stored in the C:\Users\Public\Documents\DevExpress Demos 20.2\Components\WPF\CS\ChartsDemo.Wpf\Data directory by default. Click Add to include the file into the project.
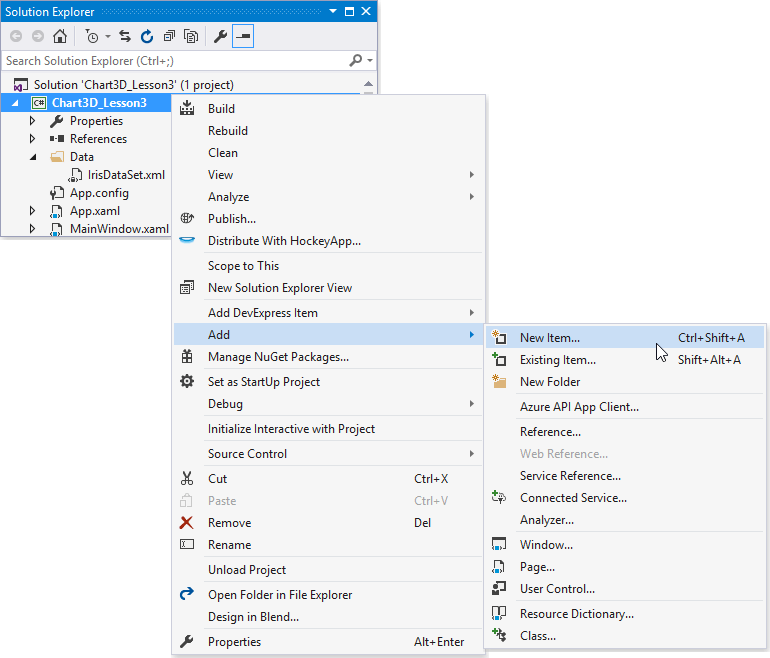
Then, you need to design a new model class. To do this, add a new code file to the project. Right-click the project and select Add | New Item.
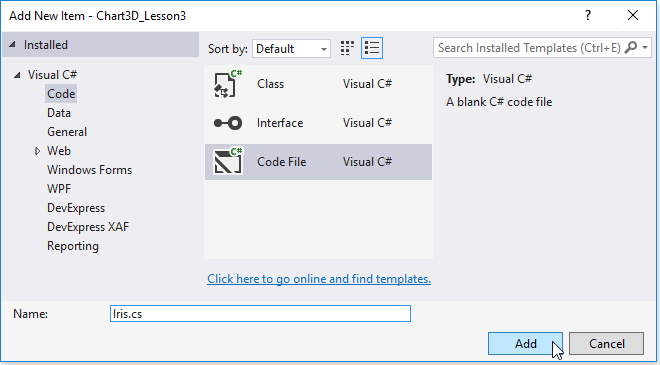
In the invoked window, select the Code group and in the item list, select the Code File item. Then, set item name to Iris.cs and click Add.
Implement the data model presentation by placing the following code to the previously created file.
namespace Chart3D_Lesson3 { public class IrisData { public string Species { get; private set; } public double SepalWidth { get; private set; } public double SepalLength { get; private set; } public double PetalWidth { get; private set; } public double PetalLength { get; private set; } public IrisData( string species, double sepalWidth, double sepalLength, double petalWidth, double petalLength ) { Species = species; SepalWidth = sepalWidth; SepalLength = sepalLength; PetalWidth = petalWidth; PetalLength = petalLength; } } }In the following step, develop a View Model that will load data objects from the data file based on the model. For this, create a code file as you did before, and set the file name as IrisesViewModel.
Place the code below to this blank file.
using System; using System.Collections.ObjectModel; using System.Windows; using System.Windows.Resources; using System.Xml.Linq; namespace Chart3D_Lesson3 { public class IrisesViewModel { public ObservableCollection<IrisData> Irises { get; set; } public IrisesViewModel() { this.Irises = DataLoader.GetIrises("/Data/IrisDataSet.xml"); } } static class DataLoader { public static ObservableCollection<IrisData> GetIrises(string filepath) { ObservableCollection<IrisData> irisDataSet = new ObservableCollection<IrisData>(); Uri uri = new Uri(filepath, UriKind.RelativeOrAbsolute); StreamResourceInfo info = Application.GetResourceStream(uri); XDocument document = XDocument.Load(info.Stream); if (document == null) return irisDataSet; foreach (XElement element in document.Element("IrisDataSet").Elements("IrisData")) { double sepalLength = Convert.ToDouble(element.Element("SepalLength").Value); double sepalWidth = Convert.ToDouble(element.Element("SepalWidth").Value); double petalLength = Convert.ToDouble(element.Element("PetalLength").Value); double petalWidth = Convert.ToDouble(element.Element("PetalWidth").Value); string species = element.Element("Species").Value.ToString(); irisDataSet.Add(new IrisData(species, sepalWidth, sepalLength, petalWidth, petalLength)); } return irisDataSet; } } }- Build the solution.
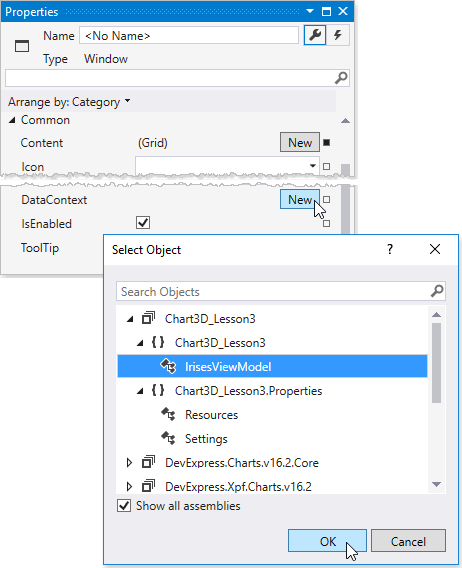
Then, assign the ViewModel to the Window.DataContext property. To do this, select the window in the design view. Then, locate the DataContext property in the Properties window and click the New button opposite this property. In the invoked dialog, select the Chart3D_Lesson3.IrisesViewModel class and click OK.
The preparatory phase is completed. Go to the next step to learn how to bind a chart to the data source.
Step 2. Add a Chart and Bind It to Data
In this section, you will add a chart and bind this chart to the prepared data source. Follow the steps below to do this.
- Add the Chart3DControl component to the main window, as you did in Lesson 1 (Step 1).
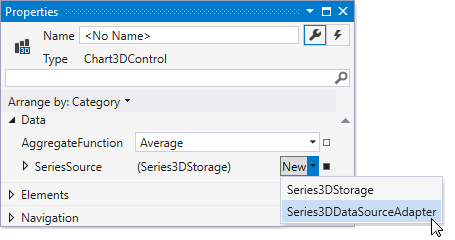
Then, change the default series 3D storage to an Series3DDataSourceAdapter object. For this, locate the Chart3DControl.SeriesSource property in the Properties window and select the Series3DDataSourceAdapter item in the drop-down list.
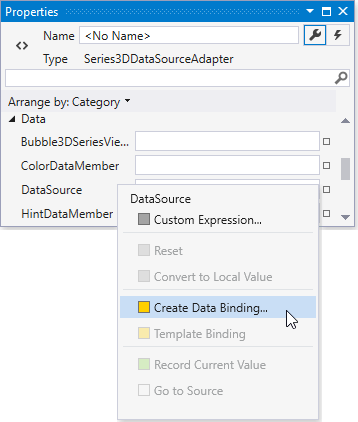
Locate the Series3DDataSourceAdapter.DataSource property in the Properties window and click the property marker. Select the Create Data Binding… item.
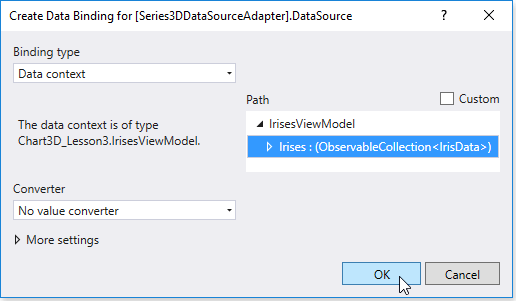
In the invoked Create Data Binding window, select the Irises property of the ViewModel and click OK.
Specify the data members that will be define data source fields used to provide the chart with data as follows.
Property Value Series3DDataSourceAdapter.SeriesDataMember Species Series3DDataSourceAdapter.XArgumentDataMember SepalLength Series3DDataSourceAdapter.YArgumentDataMember PetalLength Series3DDataSourceAdapter.ValueDataMember SepalWidth Bubble3DSeriesView.WeightDataMember PetalWidth 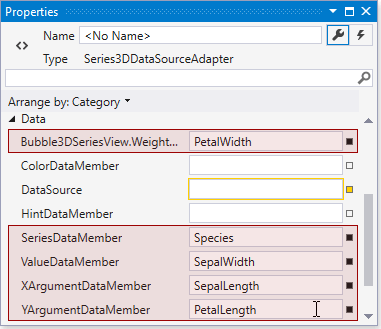
Step 3. Customize Chart Appearance
In this step, you will learn how to configure the appearance chart settings. To do this, follow the steps below.
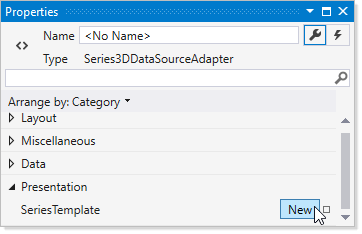
To modify appearance of all generated series, use a series template. To create a new template, locate the Series3DDataSourceAdapter.SeriesTemplate property in the Properties window and click the New button.
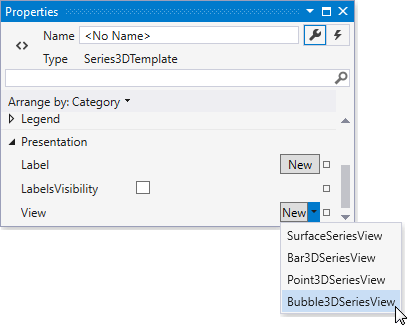
Then, alter the series view. To do this, locate the Series3DBase.View property and select the Bubble3DSeriesView item in the drop-down list.
Modify the series point form. For this, specify the Marker3DSeriesView.MarkerModel property to a Marker3DSpherePointModel object.
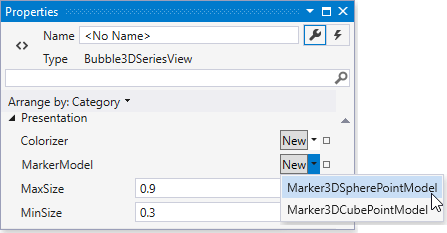
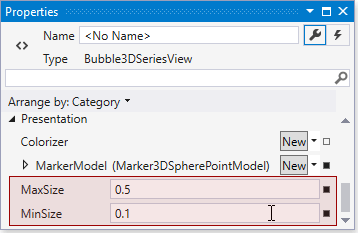
Define the Bubble3DSeriesView.MaxSize property to 0.5 to set the maximum bubbles size. Define the Bubble3DSeriesView.MinSize property to 0.1 to set the minimum bubbles size.
Result
After performing all the steps above, your code will appear as follows.
<Window
        xmlns="http://schemas.microsoft.com/winfx/2006/xaml/presentation"
        xmlns:x="http://schemas.microsoft.com/winfx/2006/xaml"
        xmlns:d="http://schemas.microsoft.com/expression/blend/2008"
        xmlns:mc="http://schemas.openxmlformats.org/markup-compatibility/2006"
        xmlns:local="clr-namespace:Chart3D_Lesson3"
        xmlns:dxc="http://schemas.devexpress.com/winfx/2008/xaml/charts"
        x:Class="Chart3D_Lesson3.MainWindow"
        mc:Ignorable="d"
        Title="MainWindow" Height="350" Width="525">
    <Window.DataContext>
        <local:IrisesViewModel/>
    </Window.DataContext>
    <Grid>
        <dxc:Chart3DControl>
            <dxc:Chart3DControl.Legends>
                <dxc:Legend BorderBrush="Transparent" Background="Transparent"/>
            </dxc:Chart3DControl.Legends>
            <dxc:Series3DDataSourceAdapter DataSource="{Binding Irises}"
                                           XArgumentDataMember="SepalLength"
                                           YArgumentDataMember="PetalLength"
                                           ValueDataMember="SepalWidth"
                                           SeriesDataMember="Species"
                                           dxc:Bubble3DSeriesView.WeightDataMember="PetalWidth" >
                <dxc:Series3DDataSourceAdapter.SeriesTemplate>
                    <dxc:Series3DTemplate>
                        <dxc:Series3DTemplate.View>
                            <dxc:Bubble3DSeriesView MaxSize="0.5"
                                                    MinSize="0.1">
                                <dxc:Bubble3DSeriesView.MarkerModel>
                                    <dxc:Marker3DSpherePointModel/>
                                </dxc:Bubble3DSeriesView.MarkerModel>
                            </dxc:Bubble3DSeriesView>
                        </dxc:Series3DTemplate.View>
                    </dxc:Series3DTemplate>
                </dxc:Series3DDataSourceAdapter.SeriesTemplate>
            </dxc:Series3DDataSourceAdapter>
        </dxc:Chart3DControl>
    </Grid>
</Window>
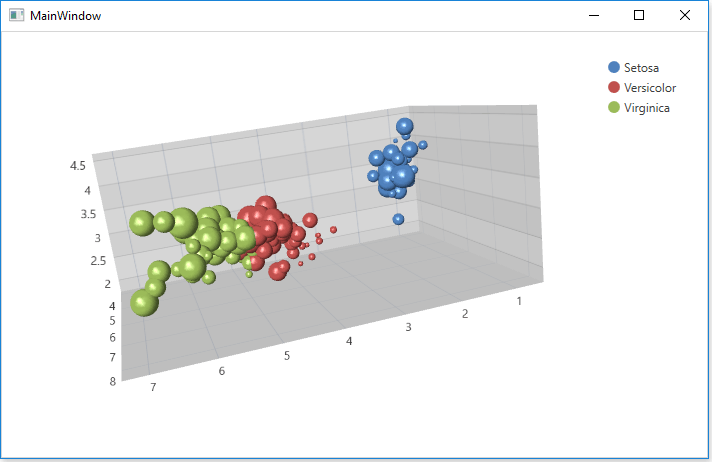
Run the project to see the results. The following image shows the resulting chart while the application is running.