Interactivity
- 2 minutes to read
The Chart3D control supports interactivity. With chart interactivity enabled, end-users can rotate, move and scale the chart diagram. End-users may also track data point values using the Crosshair Cursor.

The following sections describe the end-user interactivity features of the Chart3D control.
Runtime Zooming, Moving and Rotation
To allow end-users to zoom, pan and rotate the diagram, set the following properties to true.
- Chart3DControl.EnableRuntimeZooming - allows zooming.
- Chart3DControl.EnableRuntimeScrolling - allows panning.
- Chart3DControl.EnableRuntimeRotation - allows rotation.
The following actions are supported by the Chart3D.
| Action | Effect |
|---|---|
| Press the keyboard arrow keys | Shifts the chart in the direction specified by the keyboard arrow key. |
| Press “+” or “-“ key on the numeric keypad | If an end-user presses “+” on the numeric keypad, the chart diagram zooms in. If an end-user presses “-“ on the numeric keypad, the chart diagram zooms out. |
| Drag the mouse pointer while holding down the left mouse button in the diagram | Rotates chart in the same direction that the mouse pointer was moved. |
| Scroll the mouse wheel | Zooms in and out of the chart diagram in the same manner as other Windows applications with end-user zoom settings. |
Crosshair Cursor (Advanced Tooltip)
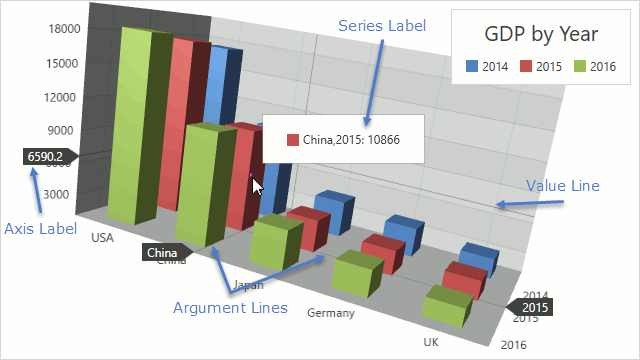
The Crosshair Cursor allows for the tracking of series point coordinates on a chart. It can also be used for comparing data from multiple graphs.
The Crosshair Cursor consists of the following elements: three lines indicating coordinates of a point in 3D space that is under the mouse cursor; labels of these lines showing coordinate values; and the series label containing arguments, a value and a marker of a series point, that is under the mouse cursor.
The following XAML demonstrates how to customize the Crosshair Cursor.
<dxc:Chart3DControl>
    <dxc:Chart3DControl.CrosshairOptions>
        <dxc:Crosshair3DOptions XArgumentLineBrush="#FF404040"
                                YArgumentLineBrush="#FF404040"
                                ValueLineBrush="#FF404040" />
    </dxc:Chart3DControl.CrosshairOptions>
    <dxc:Chart3DControl.ZAxis>
        <dxc:ZAxis3D>
            <dxc:ZAxis3D.CrosshairAxisLabelOptions>
                <dxc:CrosshairAxisLabelOptions Pattern="{}{V:F1}" />
            </dxc:ZAxis3D.CrosshairAxisLabelOptions>
        </dxc:ZAxis3D>
    </dxc:Chart3DControl.ZAxis>
    <dxc:Series3DStorage>
        <dxc:Series3D CrosshairLabelPattern="{}{X},{Y}: {V:F0}">
            <!--Other series options.-->
        </dxc:Series3D>
    </dxc:Series3DStorage>
</dxc:Chart3DControl>
Use the following classes and members to configure the Crosshair Cursor.
| Class or Member | Description |
|---|---|
| Chart3DControl.CrosshairOptions | Specifies common options of the Crosshair Cursor. |
| Crosshair3DOptions | Defines common options of the Crosshair Cursor. |
| Series3DBase.CrosshairEnabled | Specifies whether the Crosshair series label should be shown. |
| Series3DBase.CrosshairLabelPattern | Specifies the series label text pattern. |
| Series3DBase.CrosshairLabelTemplate | Specifies the template of the series label. |
| Axis3DBase.CrosshairAxisLabelOptions | Specifies options of an axis label of the Crosshair Cursor. |
| Axis3DBase.CrosshairLabelTemplate | Specifies the template of the axis label. |
| Chart3DControl.ShowCrosshair | Programmatically invokes the Crosshair Cursor. |