Axes
- 3 minutes to read
The Chart3D control axes can be configured. For instance, axis titles and grid lines can be shown or hidden, and the axis range can be defined.
This document explains how to:
Configure Axis Elements
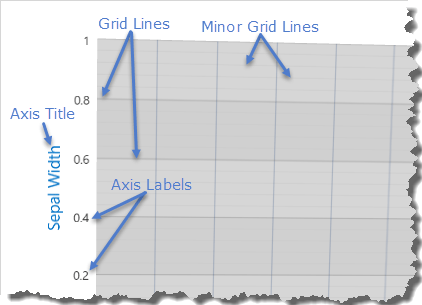
An axis consists of elements including an axis title, axis labels and grid lines. The following image highlights these axis elements.
To configure an axis, create a new instance of the axis and customize its axis element properties The XAML markup below shows how chart elements can be declared.
<dxc:Chart3DControl.YAxis>
    <dxc:YAxis3D GridLinesMinorVisible="True"
                 Interlaced="True">
        <dxc:YAxis3D.Label>
            <dxc:AxisLabel TextPattern="{}{V:F1}"/>
        </dxc:YAxis3D.Label>
        <dxc:YAxis3D.Title>
            <dxc:AxisTitle Content="Sepal Width" />
        </dxc:YAxis3D.Title>
    </dxc:YAxis3D>
</dxc:Chart3DControl.YAxis>
The following classes and properties configure the display of 3D chart axis elements
Class or Property | Description |
|---|---|
Access to the 3D Chart X, Y and Z axes of a 3D chart. | |
The X (argument) axis of a 3D Chart. | |
The Y (argument) axis of a 3D Chart. | |
The Z (value) axis of a 3D Chart. | |
Access to the title configuration of an axis. | |
Defines axis title options. | |
Access to the label configuration of an axis. | |
Defines axis label options. | |
Specifies whether major axis grid lines should be shown. | |
Specifies whether minor axis grid lines should be shown. | |
Specifies the number of minor grid lines. | |
Specifies whether interlacing is applied to the axis. |
Configure Axis Scales
The scale type of an argument axis is based on the scale type defined by a series. Argument scale types are defined on each series by the Series3DBase.XArgumentScaleType property for the X axis, and the Series3DBase.YArgumentScaleType property for the Y axis. Each argument axis allows for one of the three scale types.
| Scale Type | Configuration Properties |
|---|---|
| Qualitative | The AxisBase.QualitativeScaleComparer property specifies the ordering of qualitative values. |
| Numeric | The ArgumentAxis3D.NumericScaleOptions property specifies the numeric scale options. |
| Date-Time | The ArgumentAxis3D.DateTimeScaleOptions property specifies the date-time scale options. |
Notably, the scale type of the Z-axis is always Numeric.
The following XAML demonstrates how to configure scale options.
<dxc:Chart3DControl.XAxis>
    <dxc:XAxis3D>
        <dxc:XAxis3D.DateTimeScaleOptions>
            <dxc:AutomaticDateTimeScaleOptions WorkdaysOnly="True"/>
        </dxc:XAxis3D.DateTimeScaleOptions>
    </dxc:XAxis3D>
</dxc:Chart3DControl.XAxis>
<dxc:Chart3DControl.YAxis>
    <dxc:YAxis3D>
        <dxc:YAxis3D.NumericScaleOptions>
            <dxc:ContinuousNumericScaleOptions GridAlignment="2"/>
        </dxc:YAxis3D.NumericScaleOptions>
    </dxc:YAxis3D>
</dxc:Chart3DControl.YAxis>
The above markup includes two unfamiliar classes: AutomaticDateTimeScaleOptions and ContinuousNumericScaleOptions. These are among a set of classes that define the behavior of the corresponding scale types. The following scale behaviors are defined.
Behavior | Classes Implementing It | Description |
|---|---|---|
Manual | With manual behavior enabled, the axis scale is divided into intervals specified by the MeasureUnit property. Aggregation can be applied to series data. | |
Automatic | With automatic behavior enabled, the axis scale is divided into intervals automatically calculated by the AutomaticMeasureUnitsCalculator property. Aggregation can be applied to series data. | |
Continuous | With continuous behavior enabled, the axis scale is not divided into intervals, so aggregation cannot be applied when this behavior is used. |
Specify Axis Range
The range of values that should be shown along an axis is given by its Whole Range. Note that a range cannot be defined over a qualitative scale type.
The following XAML demonstrates how to specify the range.
<dxc:Chart3DControl.ZAxis>
    <dxc:ZAxis3D>
        <dxc:ZAxis3D.WholeRange>
            <dxc:Range MinValue="10"
                       MaxValue="15"
                       dxc:ZAxis3D.AlwaysShowZeroLevel="False"/>
        </dxc:ZAxis3D.WholeRange>
    </dxc:ZAxis3D>
</dxc:Chart3DControl.ZAxis>
The following table contains the classes and properties used by the above markup.
| Class or Property | Description |
|---|---|
| Axis.WholeRange | Specifies the range of values that should be shown along an axis. |
| Range | Defines the common settings for an axis range. |
| Range.MinValue | Specifies the minimum range value of an axis. |
| Range.MaxValue | Specifies the maximum range value of an axis. |
| ZAxis3D.AlwaysShowZeroLevel | An attached property that specifies whether a zero value should be displayed. |