Lesson 2 - Create a Chart3D Control with a Series Bound to Data
- 10 minutes to read
In this lesson, you’ll go through steps required to visualize a data source.
The following steps should be performed.
- Step 1. Prepare an Application
- Step 2. Add a Chart and a Series Bound to Data
- Step 3. Configure the Series View
- Result
Step 1. Prepare an Application
You will add a data file with the Model and ViewModel classes to the project.
- Run MS Visual Studio 2010, 2012, 2013, or 2015.
- Create a new WPF Application project.
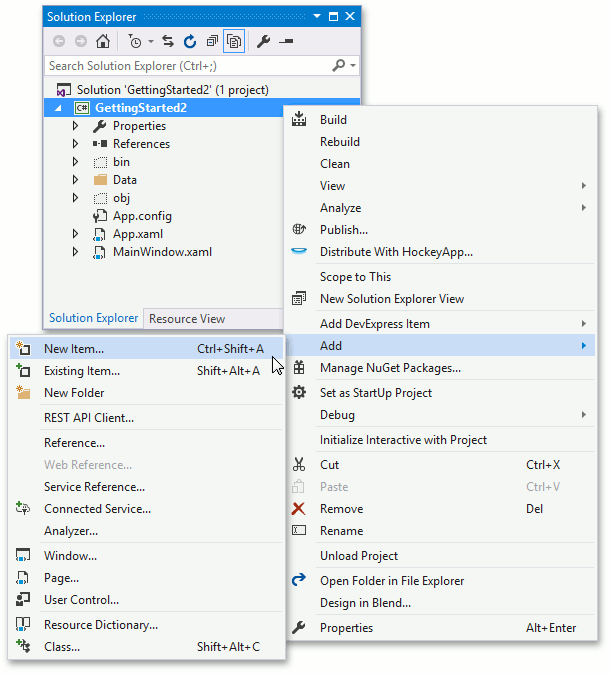
Add a new model class. For this, right-click the project in the Solution Explorer. From the invoked menu, select the Add | New Item… element.
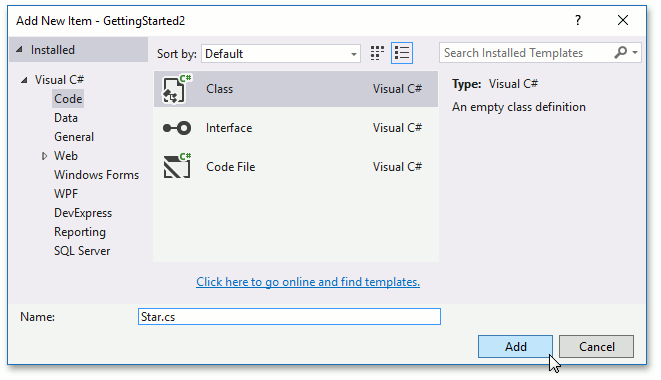
In the invoked Add New Item dialog, select the Code group and then Class from the item list. Set the file name to Star.cs and click OK.
Replace the code that the added file contains with the following code describing the model object used in this getting started lesson.
namespace GettingStarted2 { public struct Star { public int HipID { get; private set; } public string Spectr { get; private set; } public double Luminocity { get; private set; } public double ColorIndex { get; private set; } public double X { get; private set; } public double Y { get; private set; } public double Z { get; private set; } public Star( int id, double x, double y, double z, string spectr, double luminocity, double colorIndex ) { HipID = id; X = x; Y = y; Z = z; Spectr = spectr; Luminocity = luminocity; ColorIndex = colorIndex; } } }Add the data file to the project. Copy the stardata.csv file shipped with the DevExpress Charts Demo to the newly created Data directory within the project directory.
Note
By default, this file is available in the C:\Users\Public\Documents\DevExpress Demos 19.1\Components\WPF\CS\ChartsDemo.Wpf\Data directory.
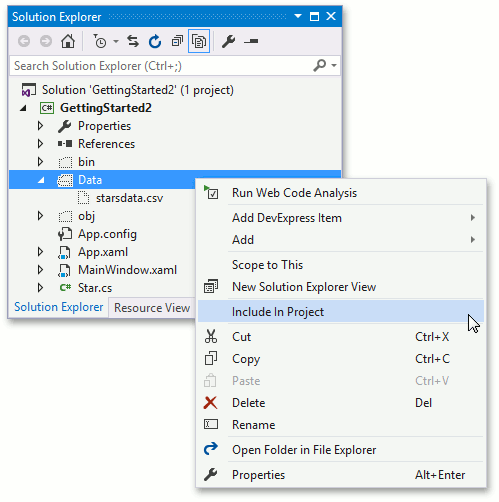
In the Solution Explorer, toggle the Show All Files button and right-click the Data directory. From the invoked menu, select Include In Project.
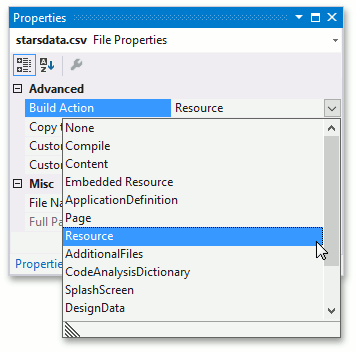
Click the stardata.csv file within the Solution Explorer, and in the Properties window, set the Build Action property to Resource.
The ViewModel should load model objects from the data file. Add the file to the project for a new ViewModel, as was previously done for the model.
Replace the code within the new file with the following code.
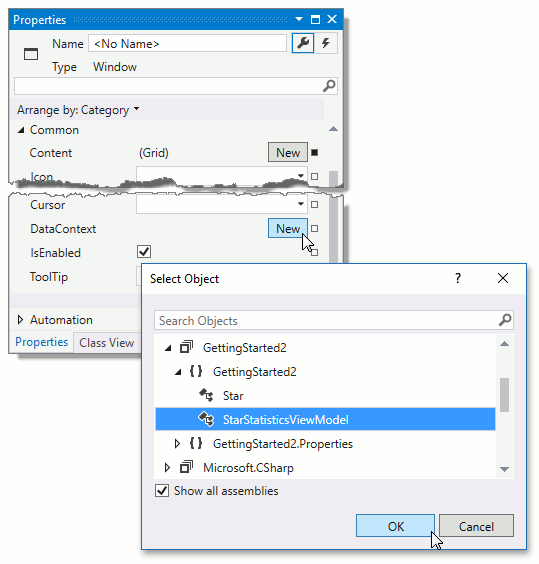
using System; using System.Collections.Generic; using System.Collections.ObjectModel; using System.Globalization; using System.IO; using System.Windows; using System.Windows.Resources; namespace GettingStarted2 { public class StarStatisticsViewModel { public IEnumerable<Star> Stars { get; } public StarStatisticsViewModel() { Stars = StarStatisticsLoader.Load("/Data/starsdata.csv"); } } static class StarStatisticsLoader { public static IEnumerable<Star> Load(string filepath) { StreamResourceInfo streamInfo = Application.GetResourceStream( new Uri(filepath, UriKind.RelativeOrAbsolute) ); StreamReader reader = new StreamReader(streamInfo.Stream); Collection<Star> stars = new Collection<Star>(); while (!reader.EndOfStream) { String dataLine = reader.ReadLine(); String[] serializedValues = dataLine.Split(';'); stars.Add( new Star( id: Convert.ToInt32(serializedValues[0], CultureInfo.InvariantCulture), x: Convert.ToDouble(serializedValues[3], CultureInfo.InvariantCulture), y: Convert.ToDouble(serializedValues[4], CultureInfo.InvariantCulture), z: Convert.ToDouble(serializedValues[5], CultureInfo.InvariantCulture), spectr: serializedValues[1], luminocity: Convert.ToDouble(serializedValues[6], CultureInfo.InvariantCulture), colorIndex: Convert.ToDouble(serializedValues[2], CultureInfo.InvariantCulture) ) ); } return stars; } } }Now, assign the ViewModel to the Window.DataContext property: select the Window, locate the DataContext property, and click the New button. In the invoked window, select the GettingStarted.StarDataViewModel class and click OK.
The preparatory work is finished. The next set of steps details how to add the Chart3D control, assign data, and customize display settings.
Step 2. Add a Chart and a Series Bound to Data
The Chart3D control will be added, and a series will be populated with view model data.
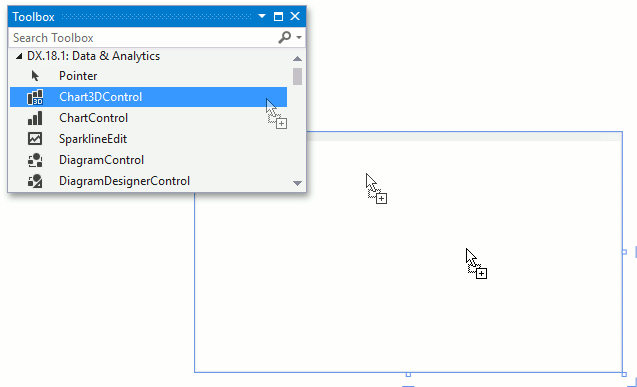
To add the Chart3DControl to the form, drag it from the toolbox. The control can be found in the DX.19.1: Data & Analytics tab.
After placing the control, right-click it and from the invoked menu, select Layout | Reset All.
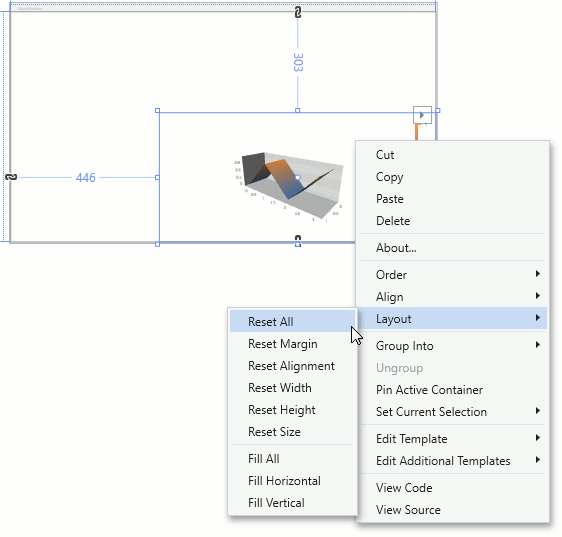
Note
By default, after the Chart3D control is added from the toolbox, it will contain a legend and series storage that stores series with manually populated series points.
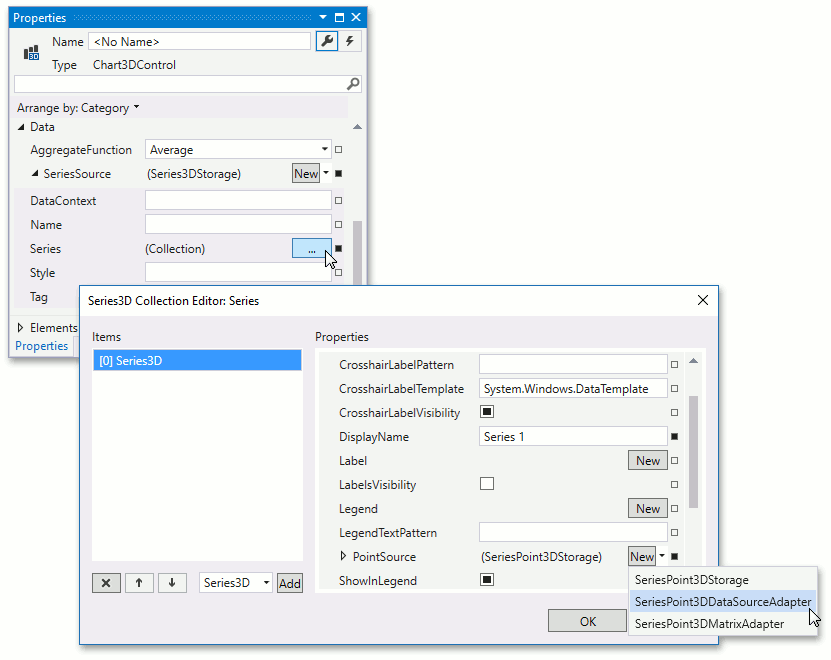
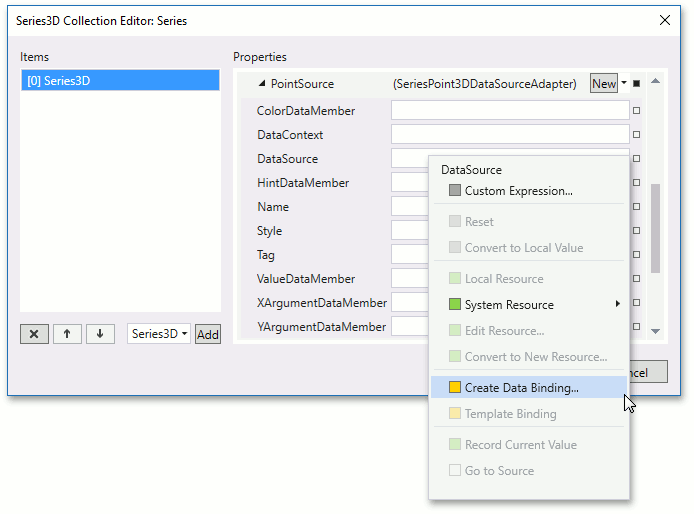
Now, display the view model data within Chart3D series. To do so, locate the Chart3DControl.SeriesSource property in the Properties window and expand it. Locate the Series3DStorage.Series property and click the ellipsis button opposite it. Then, in the invoked Series3D Collection Editor, select the Series3D series and in the Properties list, set the Series3D.PointSource property to SeriesPoint3DDataSourceAdapter.
Locate the SeriesPoint3DDataSourceAdapter.DataSource property and click the property marker. From the invoked menu, select Create Data Binding….
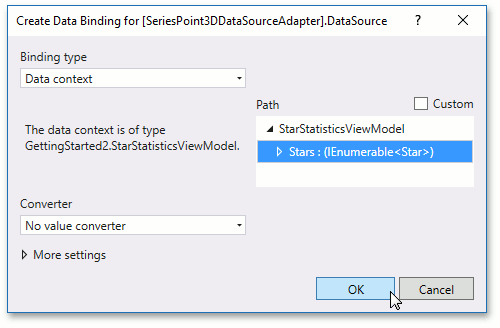
In the invoked Create Data Binding dialog window, select the Stars property of the ViewModel and click OK.
Now, specify the names of data members used for arguments and values of points. Set the Series3DDataSourceAdapter.XArgumentDataMember property to X, Series3DDataSourceAdapter.YArgumentDataMember to Y and Series3DDataSourceAdapter.ValueDataMember to Z. Also, set the SeriesPoint3DDataSourceAdapter.ColorDataMember property to ColorIndex. Data source values specified by this property will colorize the points. Click OK to close the Editor and save changes.
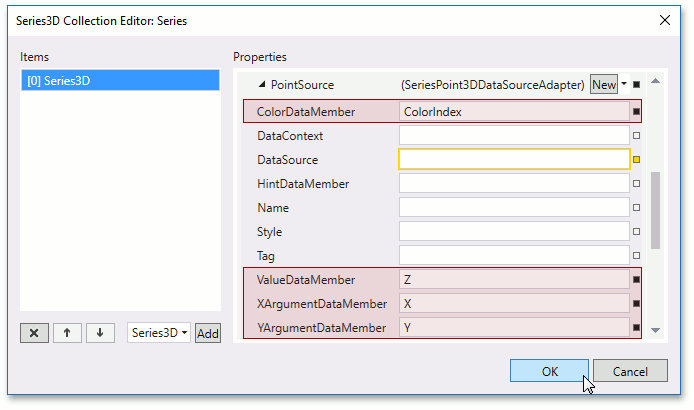
Chart3D data is configured. Currently, XAML markup of the series should appear as follows.
<dxc:Series3D DisplayName="Series 1">
    <dxc:Series3D.View>
        <dxc:SurfaceSeriesView>
            <dxc:SurfaceSeriesView.FillStyle>
                <dxc:GradientFillStyle/>
            </dxc:SurfaceSeriesView.FillStyle>
        </dxc:SurfaceSeriesView>
    </dxc:Series3D.View>
    <dxc:SeriesPoint3DDataSourceAdapter DataSource="{Binding Stars}"
                                        XArgumentDataMember="X"
                                        YArgumentDataMember="Y"
                                        ValueDataMember="Z"
                                        ColorDataMember="ColorIndex"/>
</dxc:Series3D>
The data was bound to the Chart3D control. The next step will configure appearance options for the series.
Step 3. Configure the Series View
The appearance of series will be configured. A different series view will be assigned. Additionally, a colorizer that colorizes points by their ColorIndex values will be used to provide colors.
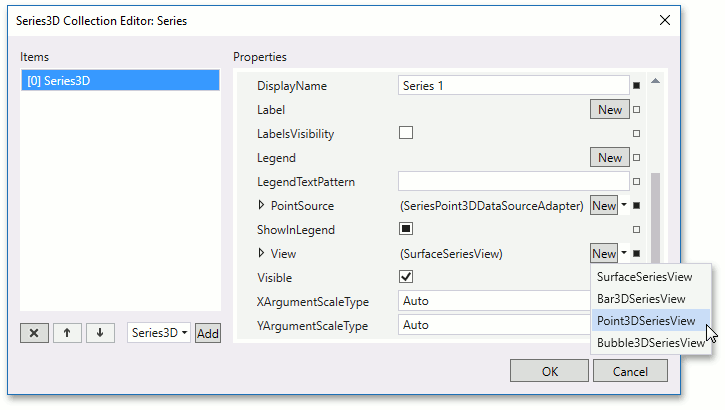
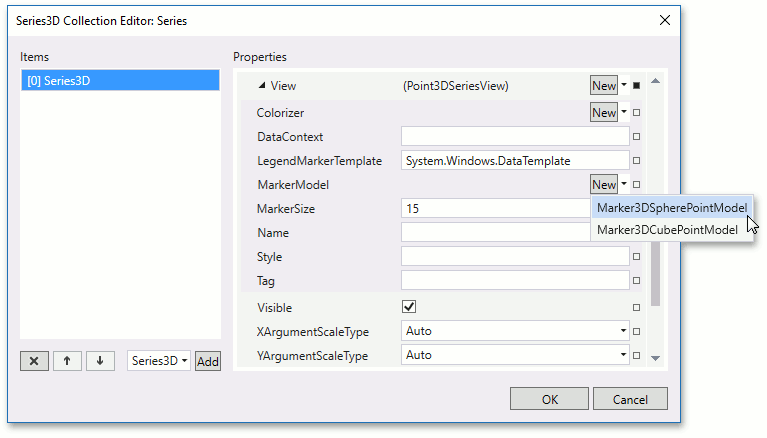
Open the Series Collection Editor and select the Series3D. Locate the Series3DBase.View property and set it to Point3DSeriesView.
Expand the view properties, locate the Marker3DSeriesView.MarkerModel property and assign it to the SphereMarker3DModel object.
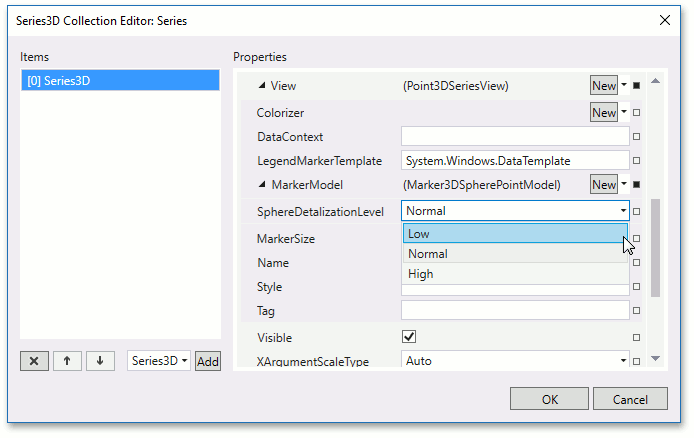
Then, expand the model properties and set its Marker3DSpherePointModel.SphereDetalizationLevel property to Low. This should improve application performance.
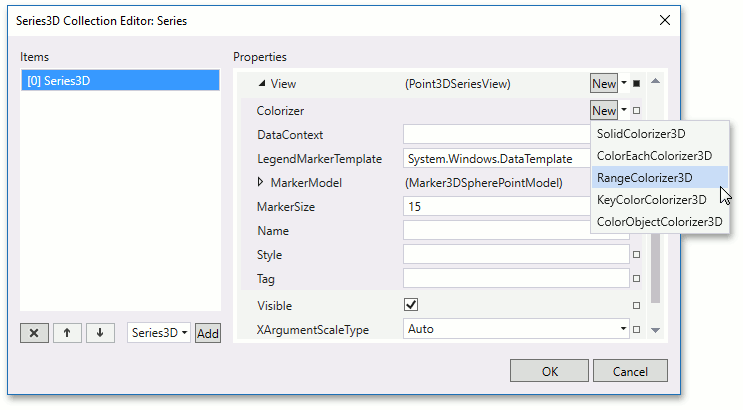
Locate the Series3DViewBase.Colorizer property and set it to RangeColorizer3D.
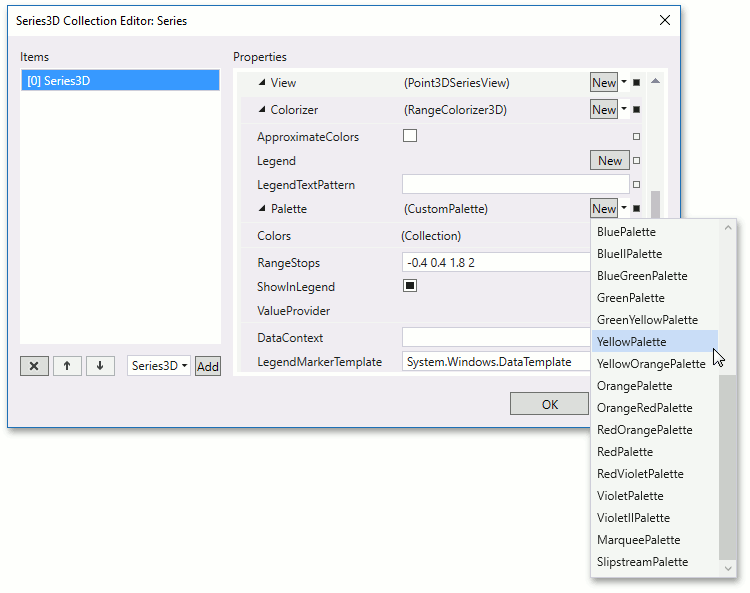
Expand the colorizer’s properties and set its RangeColorizer3D.RangeStops to -0.4 0.4 1.8 2.
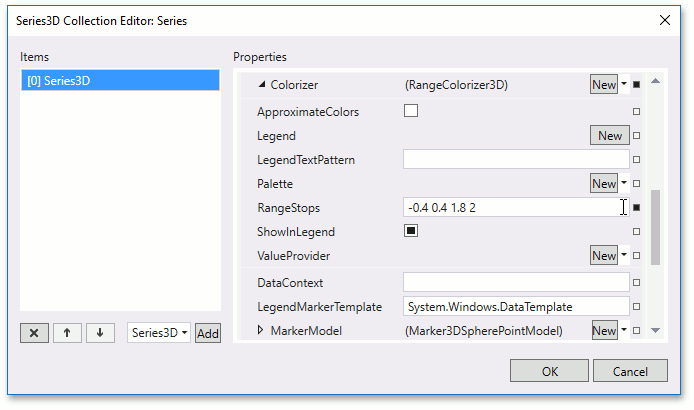
Specify the YellowPalette object as the PaletteColorizer3DBase.Palette property value.
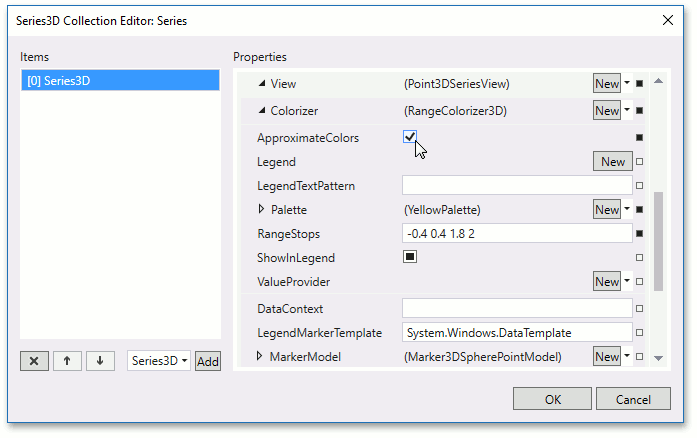
Set the RangeColorizer3D.ApproximateColors property to true.
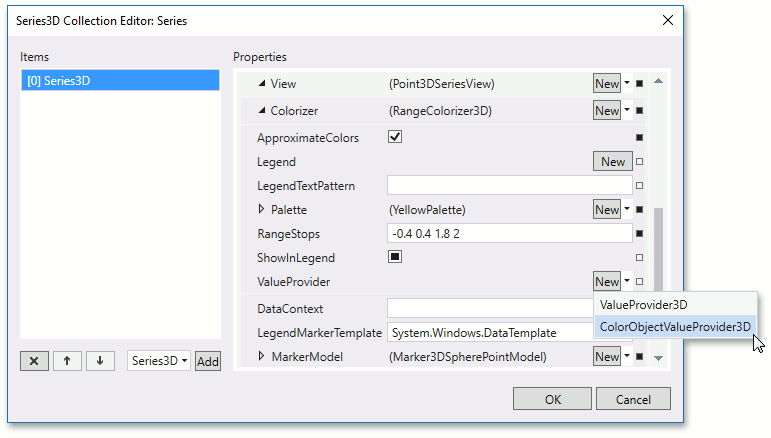
Finally, set RangeColorizer3D.ValueProvider to a new ColorObjectValueProvider3D object and click OK to close the editor and save changes.
Currently, the XAML markup of the series should look as follows.
<dxc:Series3D DisplayName="Series 1">
    <dxc:Series3D.View>
        <dxc:Point3DSeriesView>
            <dxc:Point3DSeriesView.MarkerModel>
                <dxc:Marker3DSpherePointModel SphereDetalizationLevel="Low"/>
            </dxc:Point3DSeriesView.MarkerModel>
            <dxc:Point3DSeriesView.Colorizer>
                <dxc:RangeColorizer3D RangeStops="-0.4 0.4 1.8 2"
                                      ApproximateColors="True">
                    <dxc:RangeColorizer3D.ValueProvider>
                        <dxc:ColorObjectValueProvider3D/>
                    </dxc:RangeColorizer3D.ValueProvider>
                    <dxc:RangeColorizer3D.Palette>
                        <dxc:YellowPalette/>
                    </dxc:RangeColorizer3D.Palette>
                </dxc:RangeColorizer3D>
            </dxc:Point3DSeriesView.Colorizer>
        </dxc:Point3DSeriesView>
    </dxc:Series3D.View>
    <!--Point Source Configuration -->
</dxc:Series3D>
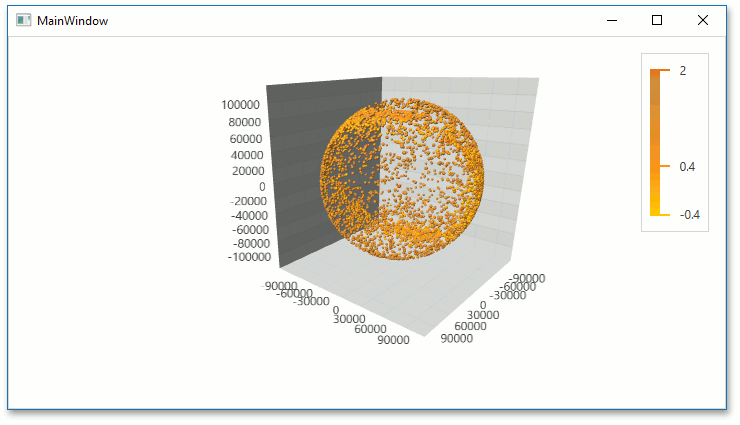
Result
The image below demonstrates the launched application.
The following code is the result of this getting started lesson.
Note
A complete sample project is available at https://github.com/DevExpress-Examples/chart3d-getting-started-lesson-2-t465331.
- Star.cs
- MainWindow.xaml (C#)
- StarDataViewModel.cs
- StarDataViewModel.vb
- MainWindow.xaml (VB.NET)
- Star.vb
namespace GettingStarted2 {
    public class Star {
        public int HipID { get; private set; }
        public string Spectr { get; private set; }
        public double Luminocity { get; private set; }
        public double ColorIndex { get; private set; }
        public double X { get; private set; }
        public double Y { get; private set; }
        public double Z { get; private set; }

        public Star(
                int id,
                double x,
                double y,
                double z,
                string spectr,
                double luminocity,
                double colorIndex
        ) {
            HipID = id;
            X = x;
            Y = y;
            Z = z;
            Spectr = spectr;
            Luminocity = luminocity;
            ColorIndex = colorIndex;
        }
    }
}