Canvas
- 3 minutes to read
Overview
The Canvas is a working area where end-users build diagrams using shapes and connectors. Its features include:
Grid and rulers
The grid and rulers help end-users arrange shapes on the canvas. Their visibility can be toggled on the View page of the Ribbon. The grid is dynamically changed during zooming. When the end-user zoom in or out of the drawing, the grid spacing is adjusted automatically to be more appropriate for the new magnification.
Page breaks
The Canvas is composed of drawing pages. The number of drawing pages can be adjusted depending on the diagram size. To learn more about pages, see Page Setup.
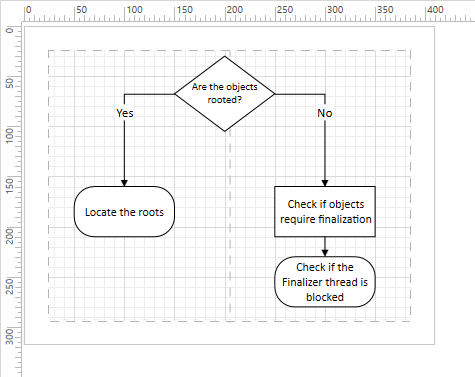
The following image demonstrates a simple block diagram that occupies 2 drawing pages. The Canvas displays grid lines, rulers, and line breaks.
The table below lists the main properties that affect the canvas behavior and appearance.
Characteristics | Members |
|---|---|
Grid line visibility | |
Ruler visibility | |
Page break visibility | |
Size | |
Background | |
Page background | |
Scrollling mode | |
Snapping shapes into position |
To scroll the diagram contents in code, use the DiagramControl.ScrollToPoint method. Alternatively, use the DiagramControl.FitToItems method to scroll the diagram and change its zoom factor so that the viewport is sufficiently large to display the specified items.
Basic Actions
To scroll the diagram contents
Select the pan tool in the Tools group of the Ribbon and drag on the canvas or use the scrollbars.
To add a shape to the canvas
Drag the shape from the Shapes Panel or select a drawing tool (Rectangle, Ellipse, Right Triangle, Hexagon) in the Tools group of the Ribbon and drag on the canvas to draw the corresponding shape.
To select a shape on the canvas
Choose the Pointer tool on the Tools Ribbon group and click a shape you want to select.
To select multiple shapes on the canvas
Hold down the CTRL key and click each item you want to select.
Alternatively, draw a selection rectangle around the shapes you want to select. The selection rectangle appears when you drag the mouse pointer.
To resize a shape
Select the shape and drag a selection handle or change the Size property in the Properties Panel.
To move a shape
Select the shape and use the arrow keys on your keyboard or drag with the mouse. You can also change the Position property in the Properties panel.
To rotate a shape
Select the shape and drag the rotation handle with the mouse or change the Angle property in the Properties panel.
To add a connector
Select the Connector tool in the Tools group of the Ribbon and drag on the canvas.
To initiate text editing
Double-click a shape or right-click it and select the Edit text menu item. You can also change the Text property within the Properties panel. The text can be formatted using the Ribbon.
To undo or redo an action
Click the corresponding button  at the top of the Ribbon or press the CTRL+Z / CTRL+Y key combination.
To change the current zoom
Hold the CTRL button and rotate the mouse wheel or use the zoom trackbar in the Bottom panel.