Key Performance Indicators (KPIs)
- 3 minutes to read
In Analysis Services, a KPI is a collection of calculations associated with a measure group in a cube, used to evaluate business success. To learn more about KPIs, see Key Performance Indicators topic in MSDN.
Pivot Grid allows you to display KPI values with server-defined or client-defined graphics.
Displaying KPI Values
Use the PivotGridControl.GetOlapKpiList method to obtain a list of KPI names provided by the OLAP cube. A typical KPI consists of the actual value achieved, the goal, status, trend and weight values. In the OLAP cube, a KPI’s value is represented by a measure to which a PivotGridControl’s field should be bound to display the KPI value. The PivotGridControl.GetOlapKpiMeasures method returns the names of measures that represent the values of the specified KPI. The actual KPI values can be obtained using the PivotGridControl.GetOlapKpiValue method.
To obtain which of the KPI values (goal, status, trend, weight, or the actual value) a particular field is displaying, use the field’s PivotGridField.KpiType property.
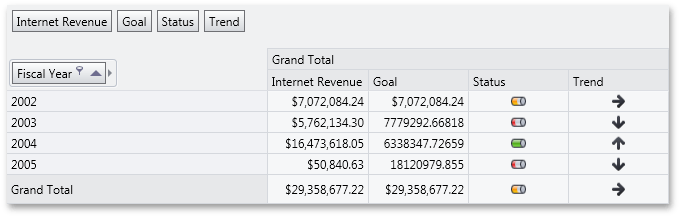
Managing KPI Graphics
DXPivotGrid can visualize KPI values with server-defined or client-defined graphics. The KPI status and trend values represent one of three progress states: good, bad and neutral. The Analysis Services provide a number of graphic sets used to visualize the state values. A graphic set consists of three images, each corresponding to a particular progress state. For instance, the cylinder graphics provide the  ,
,  and
and  images for the good, bad and neutral states respectively. Use the PivotGridField.KpiGraphic property to specify which graphic set should be used to visualize the KPI value.
To obtain which graphic set is defined for the KPI value by the server, use the PivotGridControl.GetOlapKpiServerGraphic method. You can also obtain images used to visualize KPI values via the PivotGridControl.GetKpiBitmap method.
Note
If the PivotGridField.KpiGraphic property is not set to PivotKpiGraphic.ServerDefined, KPI graphics can be displayed for table data sources as well. In this instance, valid KPI values are -1 (bad), 0 (neutral) and 1 (good).
Appearance of KPI Cells
PivotGridControl allows you to customize the appearance of cells that display KPI graphics. To do this, use the PivotGridControl.FieldCellKpiTemplate property to specify a template that will be used to display these cells.
You can also implement custom logic that will choose an appropriate template. To do this, derive from the DataTemplateSelector class, implement the SelectTemplate method that returns a template that meets the required condition, and assign an instance of this class to the PivotGridControl.FieldCellKpiTemplateSelector property.
To do this for individual fields, use the PivotGridField.CellTemplate and PivotGridField.CellTemplateSelector properties respectively.
Note that the PivotGridControl.FieldCellTemplate and PivotGridControl.FieldCellTemplateSelector properties are not in effect for data fields that display KPI graphics.