Stacked Step Area
- 2 minutes to read
The Stacked Step Area series can be plotted using the AreaStepStackedSeries2D class, which belongs to the Area Series group. This series is similar to Stacked Area, but it does not use the shortest distance to connect two data points. Instead, this chart type uses vertical and horizontal lines to connect the data points in a series forming a step-like progression.
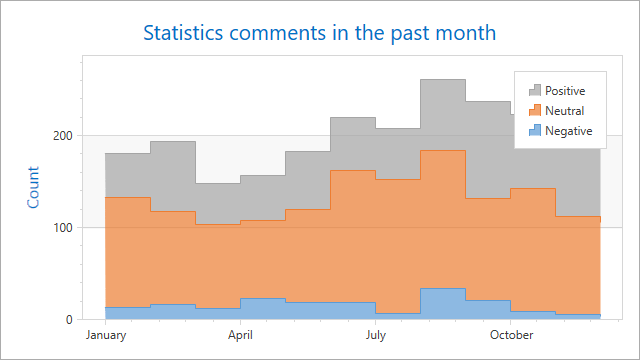
A Stacked Step Area chart is shown in the image below. Note that this chart type is based on the XYDiagram2D. It can be rotated to show areas either vertically or horizontally.
Note
If two stacked areas contain data points for different arguments, points for missing arguments are not treated as zero-value points.
A Stacked Area chart can display series containing data points with positive and negative values. However, a series with positive values is stacked only with other series containing positive values; and a series with negative values is stacked with other series containing negative values.
Note that if a series contains data points with both positive and negative values, it is treated as a series with positive values, while all its negative values are treated as zeros.
Series Characteristics
The table below lists the main features of this chart type.
| Feature | Value |
|---|---|
| Series View type | AreaStepStackedSeries2D |
| Diagram type | XYDiagram2D |
| Number of arguments per series point | 1 |
| Number of values per series point | 1 |
Refer to the Series Type Compatibility document for information on which series view types can be combined with the Stacked Step Area view.