Annotations
- 6 minutes to read
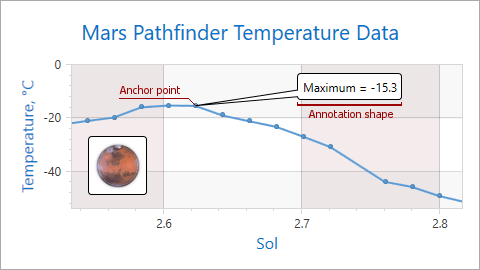
An annotation is a comment with information about the chart’s content.
The following image shows annotations with an image and text:
How to Add an Annotation
This markup shows how to add an annotation, anchor it to a chart surface’s point and define the annotation shape’s position.
<dxc:ChartControl>
    <!-- The chart collection of annotations. -->
    <dxc:ChartControl.Annotations>
        <!-- Add a new annotation and specify its content.-->
        <dxc:Annotation Content="Annotation"
                        <!-- Define an annotation margin. -->
                        Margin="50">
            <!-- Anchor an annotation to a point on the chart surface. -->
            <dxc:Annotation.AnchorPoint>
                <!-- Define an annotation anchor point's x-coordinate. -->
                <dxc:ChartAnchorPoint X="50"
                                      <!-- Define the annotation anchor point's y-coordinate. -->
                                      Y="100"/>
            </dxc:Annotation.AnchorPoint>
            <!-- Specify the annotation shape's position. -->
            <dxc:Annotation.ShapePosition>
                <!-- Define a rotation angle of an annotation connector. -->
                <dxc:RelativePosition Angle="50"
                                      <!-- Define the annotation connector's length. -->
                                      ConnectorLength="70"/>
            </dxc:Annotation.ShapePosition>
        </dxc:Annotation>
    </dxc:ChartControl.Annotations>
    <!-- Other chart settings. -->
</dxc:ChartControl>
The table below lists all the classes and properties used above:
| Class or Property | Description |
|---|---|
| ChartControl.Annotations | The chart collection of annotations. |
| Annotation | Stores annotation settings. |
| Annotation.Content | Annotation content. |
| Annotation.Margin | Gets or sets the annotation margin. |
| Annotation.AnchorPoint | Specifies the annotation anchor point. |
| Annotation.ShapePosition | Gets or sets the annotation’s position. |
Note
Set an annotation’s Annotation.Visible property to false to hide it.
Annotation Anchor Points
You can anchor an annotation to different chart elements.
The following table lists the different anchor points:
The Anchor Point Type | The Example Image | Description |
|---|---|---|
Chart |
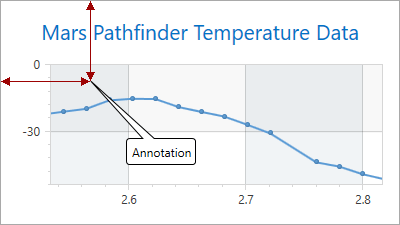
| If the Annotation.AnchorPoint property is set to ChartAnchorPoint, the ChartAnchorPoint.X and ChartAnchorPoint.Y properties define the annotation’s position. The annotation’s anchor point coordinate is absolute and does not change when you resize the chart. |
Pane |
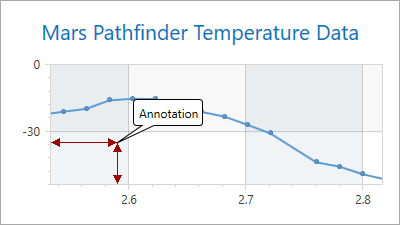
| If the Annotation.AnchorPoint property is set to PaneAnchorPoint, the PaneAnchorPoint.AxisXCoordinate and PaneAnchorPoint.AxisYCoordinate properties specify the annotation’s position. To define a pane, use the PaneAnchorPoint.Pane property. The chart does not display a pane’s annotations when the pane is removed. Example: How to: Dock an Annotation to a Pane |
Series Point |
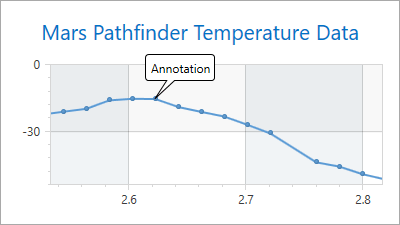
| If the Annotation.AnchorPoint property is set to SeriesPointAnchorPoint, the SeriesPointAnchorPoint.SeriesPoint property specifies the series point to which the annotation is anchored. The chart does not display the anchored annotations when the series point is removed. |
Annotation Position
The Annotation.ShapePosition property specifies the annotation’s position:
The Shape Position Type | The Example Image | Description |
|---|---|---|
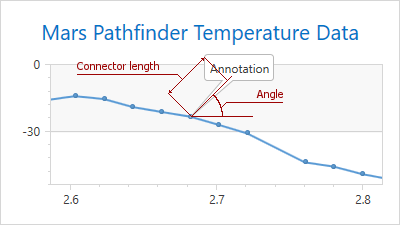
Relative Position |
| If the Annotation.ShapePosition property is set to RelativePosition, use the RelativePosition.ConnectorLength and RelativePosition.Angle properties to specify the annotation’s position. In the image, the ConnectorLength property is 70 and the RelativePosition.Angle is 45. |
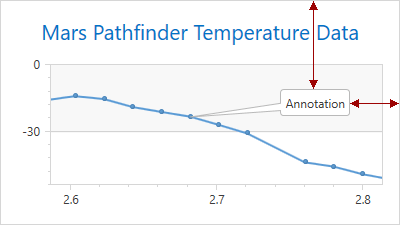
Free Position |
| If the Annotation.ShapePosition property is set to FreePosition, use the FreePosition.VerticalAlignment and FreePosition.HorizontalAlignment properties to specify the annotation’s location. Use the FreePosition.DockTarget property to define the parent element (the chart or pane). Set the Annotation.Margin property to specify the indents from the parent element’s edges. In the image, the annotation is docked to the Chart control. The HorizontalAlignment property is set to Right, VerticalAlignment to Top, and Margin to “0, 90, 50, 0”. |
Layout Customization
When an annotation does not fit into a diagram’s boundaries, it is cut off. To avoid this behavior, set the Annotation.LabelMode property to true.
| The Property Value | The Example Image |
|---|---|
| LabelMode = false | 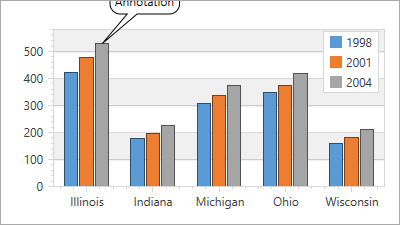 |
| LabelMode = true | 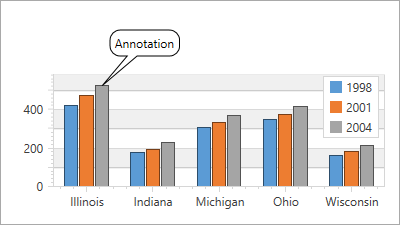 |
Use the Annotation.Angle property to rotate the annotation.
| The Property Value | The Example Image |
|---|---|
| Annotation.Angle = 0 | 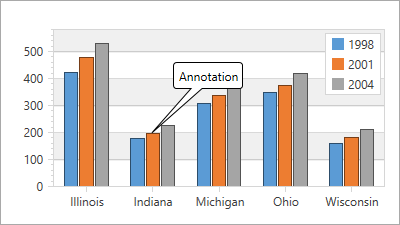 |
| Annotation.Angle = 30 | 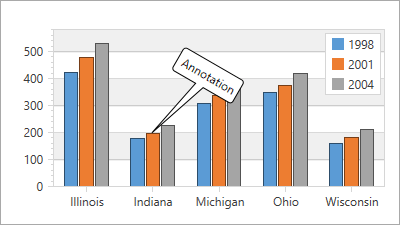 |
Generate Annotations from a View Model
The Chart Control can generate annotations from a ViewModel. Use the ChartControl.AnnotationItemsSource property to specify the collection of objects used to create annotations. The ChartControl.AnnotationItemTemplate property allows you to define the annotation settings.
<Window.DataContext>
    <viewModel:ChartViewModel/>
</Window.DataContext>
<Grid>
    <dxc:ChartControl AnnotationItemsSource="{Binding Path=Annotations, Mode=OneTime}" >
        <!-- Other chart settings are skipped. -->
        <dxc:ChartControl.AnnotationItemTemplate>
            <DataTemplate>
                <dxc:Annotation Content="{Binding Content}">
                    <dxc:Annotation.ShapePosition>
                        <dxc:RelativePosition
                            Angle="{Binding Angle}"
                            ConnectorLength="{Binding ConnectorLength}"/>
                    </dxc:Annotation.ShapePosition>
                    <dxc:Annotation.AnchorPoint>
                        <dxc:PaneAnchorPoint AxisXCoordinate="{Binding XValue}"
                                             AxisYCoordinate="{Binding YValue}"/>
                    </dxc:Annotation.AnchorPoint>
                </dxc:Annotation>
            </DataTemplate>
        </dxc:ChartControl.AnnotationItemTemplate>
    </dxc:ChartControl>
</Grid>
public class ChartViewModel {
    public IEnumerable<MyAnnotation> Annotations { get; private set; }
    public ChartViewModel() {
        Annotations = new Collection<MyAnnotation> {
            new MyAnnotation("Annotation 1", 2012, 6.203) {
                ConnectorLength = 100,
                Angle = -45
            },
            new MyAnnotation("Annotation 2", 2010, 5.7) {
                ConnectorLength = 100,
                Angle = 0
            }
        };
    }
    public class MyAnnotation {
        public string Content { get; set; }
        public AxisXCoordinate XValue { get; set; }
        public AxisYCoordinate YValue { get; set; }
        public double ConnectorLength { get; set; }
        public double Angle { get; set; }
        public MyAnnotation(string content, double xVal, double yVal) {
            Content = content;
            XValue = new AxisXCoordinate() { AxisValue = xVal };
            YValue = new AxisYCoordinate() { AxisValue = yVal };
        }
    }
}
Appearance Customization
The Annotation.ContentTemplate property allows you to configure the annotation’s appearance. Create DataTemplate to define the annotation’s appearance and assign this template to the Annotation.ContentTemplate property:
<dxc:ChartControl.Annotations>
    <dxc:Annotation>
        <dxc:Annotation.Content>
            <local:AnnotationContent Text="Annotation"
                                ImageSource="{StaticResource imageSource}"/>
        </dxc:Annotation.Content>
        <dxc:Annotation.ContentTemplate>
            <DataTemplate>
                <StackPanel Orientation="Horizontal">
                    <Label
                           Margin="0,0,4,0"
                           Content="{Binding Text}"/>
                         <Image
                                Width="48"
                                Height="48">
                             <Image.Source>
                                <BitmapImage UriSource="{Binding ImageSource}"/>
                             </Image.Source>
                         </Image>
                </StackPanel>
            </DataTemplate>
         </dxc:Annotation.ContentTemplate>
         <dxc:Annotation.AnchorPoint>
                 <dxc:ChartAnchorPoint X="200"
                                       Y="100"/>
         </dxc:Annotation.AnchorPoint>
         <dxc:Annotation.ShapePosition>
                 <dxc:RelativePosition ConnectorLength="80"
                                       Angle="-30"/>
         </dxc:Annotation.ShapePosition>
    </dxc:Annotation>
</dxc:ChartControl.Annotations>
The following image demonstrates an annotation with the customized Annotation.ContentTemplate property.
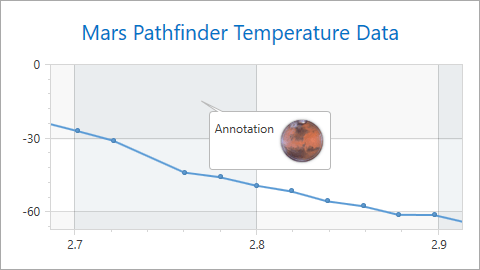
You can also use appearance properties derived from the Control class to modify annotation appearance.
End-User Capabilities
Enable the following options to allow users to customize annotations:
Annotation.RuntimeAnchoring allows users to relocate anchor points. The Annotation.RuntimeAnchoring option is only available for ChartAnchorPoint or PaneAnchorPoint.
<dxc:ChartControl ...>
     ...
     <dxc:ChartControl.Annotations>
         <dxc:Annotation Content="Annotation" RuntimeAnchoring="True" >
             <dxc:Annotation.AnchorPoint>
                 <dxc:ChartAnchorPoint X="150" Y="150"/>
             </dxc:Annotation.AnchorPoint>
             <dxc:Annotation.ShapePosition>
                 <dxc:RelativePosition ConnectorLength="60" />
             </dxc:Annotation.ShapePosition>
         </dxc:Annotation>
     </dxc:ChartControl.Annotations>
</dxc:ChartControl>
Annotation.RuntimeMoving allows users to move the annotation.
Annotation.RuntimeResizing allows users to resize the annotation.
Annotation.RuntimeRotation enables annotation rotation.

Use an instance of the EditableTextContent or EditableImageContent class to allow users to edit text, replace images, or use the Delete key to delete the annotation.

<dxc:ChartControl ...>
    ...
    <dxc:ChartControl.Annotations>
        <dxc:Annotation RuntimeResizing="True"
                        RuntimeMoving="True"
                        RuntimeRotation="True">
            <dxc:Annotation.Content>
                <dxc:EditableTextContent Text="Annotation"/>
            </dxc:Annotation.Content>
            <dxc:Annotation.AnchorPoint>
                <dxc:SeriesPointAnchorPoint SeriesPoint="{Binding ElementName=seriesPoint}"/>
            </dxc:Annotation.AnchorPoint>
            <dxc:Annotation.ShapePosition>
                <dxc:RelativePosition Angle="60" ConnectorLength="50"/>
            </dxc:Annotation.ShapePosition>
        </dxc:Annotation>
    </dxc:ChartControl.Annotations>
    ...
    <dxc:XYDiagram2D>
        <dxc:SplineSeries2D ...>
            <dxc:SeriesPoint Argument="2.466424" Value="-28.2" />
            <dxc:SeriesPoint Argument="2.486035" Value="-25.4" />
            <dxc:SeriesPoint Argument="2.505635" Value="-23.4" />
            <dxc:SeriesPoint Argument="2.525235" Value="-22.4" />
            <dxc:SeriesPoint  x:Name="seriesPoint"  Argument="2.544851" Value="-21" />
            ...
        </dxc:SplineSeries2D>
        ...
    </dxc:XYDiagram2D>
</dxc:ChartControl>
Note
If the Annotation.LabelMode property is set to true, the Annotation.RuntimeAnchoring, Annotation.RuntimeMoving, Annotation.RuntimeResizing and Annotation.RuntimeRotation properties are not in effect.