Annotations
- 5 minutes to read
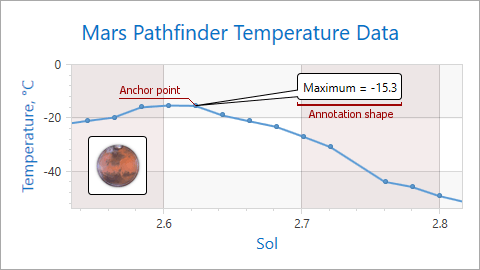
An annotation is an additional comment with explanatory information about chart content. The Chart control can display an unlimited number of annotations.
The following image demonstrates two annotations: with an image and text content.
This document consists of the following sections:
- How to Add an Annotation
- Annotation Anchor Points
- Annotation Shape Positions
- Layout Customization
- Appearance Customization
How to Add an Annotation
This markup shows how to add an annotation, anchor it to a chart surface’s point and define the annotation shape’s position.
<dxc:ChartControl>
    <!-- The chart collection of annotations. -->
    <dxc:ChartControl.Annotations>
        <!-- Add a new annotation and specify its content.-->
        <dxc:Annotation Content="Annotation"
                        <!-- Define an annotation margin. -->
                        Margin="50">
            <!-- Anchor an annotation to a point on the chart surface. -->
            <dxc:Annotation.AnchorPoint>
                <!-- Define an annotation anchor point's x-coordinate. -->
                <dxc:ChartAnchorPoint X="50"
                                      <!-- Define the annotation anchor point's y-coordinate. -->
                                      Y="100"/>
            </dxc:Annotation.AnchorPoint>
            <!-- Specify the annotation shape's position. -->
            <dxc:Annotation.ShapePosition>
                <!-- Define a rotation angle of an annotation connector. -->
                <dxc:RelativePosition Angle="50"
                                      <!-- Define the annotation connector's length. -->
                                      ConnectorLength="70"/>
            </dxc:Annotation.ShapePosition>
        </dxc:Annotation>
    </dxc:ChartControl.Annotations>
    <!-- Other chart settings. -->
</dxc:ChartControl>
The table below lists all the classes and properties used above:
| Class or Property | Description |
|---|---|
| ChartControl.Annotations | The chart collection of annotations. |
| Annotation | Stores annotation settings. |
| Annotation.Content | Annotation content. |
| Annotation.Margin | Gets or sets the annotation margin. |
| Annotation.AnchorPoint | Specifies the annotation anchor point. |
| Annotation.ShapePosition | Gets or sets the annotation shape position. |
Note
To hide an annotation without removing it, set the Annotation.Visible property to false.
Annotation Anchor Points
You can anchor an annotation to different chart elements.
The following table lists all the types of annotation anchor points:
The Anchor Point Type | The Example Image | Description |
|---|---|---|
Chart |
| If the Annotation.AnchorPoint property is specified by an object of the ChartAnchorPoint type, the ChartAnchorPoint.X and ChartAnchorPoint.Y properties define the annotation position. Note that the annotation’s anchor point coordinate is absolute and doesn’t change when you resize the chart. |
Pane |
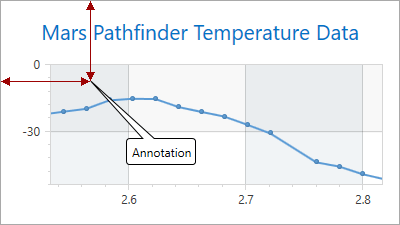
| If the Annotation.AnchorPoint property is specified by an object of the PaneAnchorPoint type, the PaneAnchorPoint.AxisXCoordinate and PaneAnchorPoint.AxisYCoordinate properties specify the annotation position. To define a pane, use the PaneAnchorPoint.Pane property. Note when the pane with annotations is removed, the chart doesn’t display annotations. Example: How to: Dock an Annotation to a Pane |
Series Point |
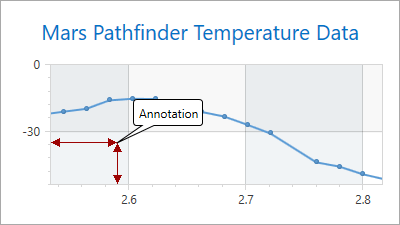
| If the Annotation.AnchorPoint property is specified by an object of the SeriesPointAnchorPoint type, the SeriesPointAnchorPoint.SeriesPoint property determines a point that serves as an anchor point. Note when the series point is removed, the chart doesn’t display the anchored annotations. |
Annotation Shape Positions
You can position an annotation’s shape relative to its anchor point coordinates (Annotation.ShapePosition is set to RelativePosition) or dock it to the parent container (chart or pane) edges (Annotation.ShapePosition is set to FreePosition).
The following table lists all the possible positions of an annotation shape:
The Shape Position Type | The Example Image | Description |
|---|---|---|
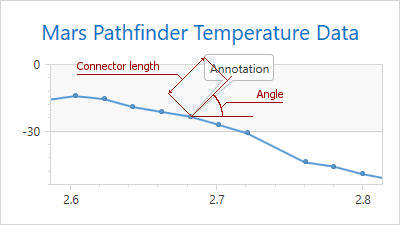
Relative Position |
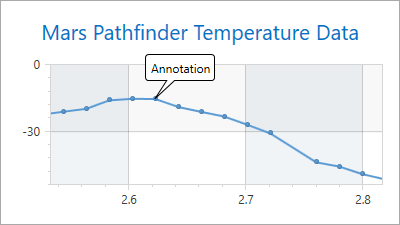
| If the Annotation.ShapePosition property is specified by an object of the RelativePosition type, you can modify the annotation’s shape position using the RelativePosition.ConnectorLength and RelativePosition.Angle properties. In the image, the ConnectorLength property is equal to 70 and the RelativePosition.Angle to 45. |
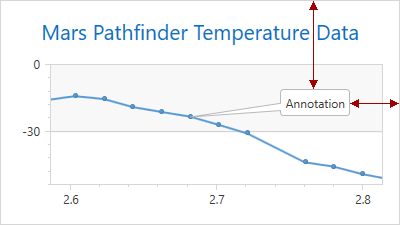
Free Position |
| If the Annotation.ShapePosition property is specified by an object of the FreePosition type, you can specify the annotation location using the FreePosition.VerticalAlignment and FreePosition.HorizontalAlignment properties. To define the parent element, use the FreePosition.DockTarget property. Set the indents from parent element edges using the Annotation.Margin property. In the image, the annotation is docked to the Chart control. The HorizontalAlignment property is set to Right, VerticalAlignment to Top, Margin to “0, 90, 50, 0”. |
Layout Customization
When an annotation does not completely fit into a diagram’s boundaries, it is cut off. To avoid this behavior, set the Annotation.LabelMode property to true.
| The Property Value | The Example Image |
|---|---|
| LabelMode = false | 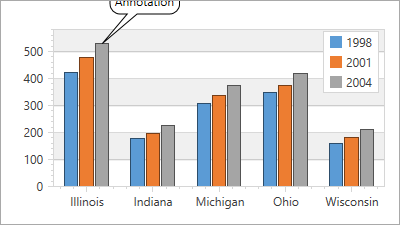 |
| LabelMode = true | 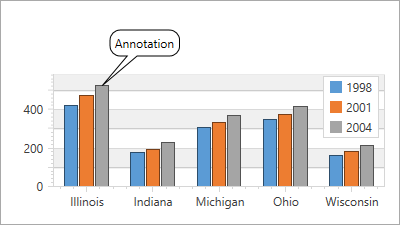 |
An end-user can relocate, rotate, resize and re-anchor an annotation using special handlers at runtime. To enable these capabilities, use the Annotation.RuntimeMoving, Annotation.RuntimeRotation, Annotation.RuntimeResizing and Annotation.RuntimeAnchoring properties respectively.
Note
If the Annotation.LabelMode property is specified to true, the Annotation.RuntimeAnchoring, Annotation.RuntimeMoving, Annotation.RuntimeResizing and Annotation.RuntimeRotation properties are not in effect.
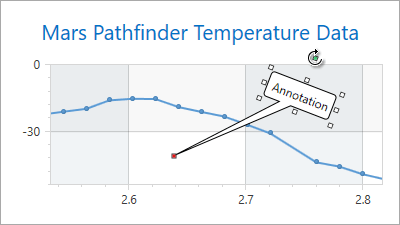
Apart from the capability to rotate an annotation around its anchor point, it is possible to rotate the annotation shape using the Annotation.Angle property.
| The Property Value | The Example Image |
|---|---|
| Annotation.Angle = 0 | 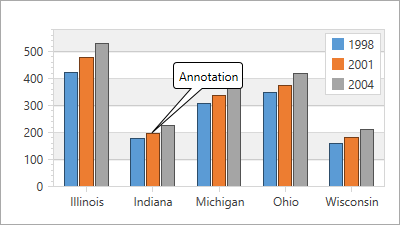 |
| Annotation.Angle = 30 | 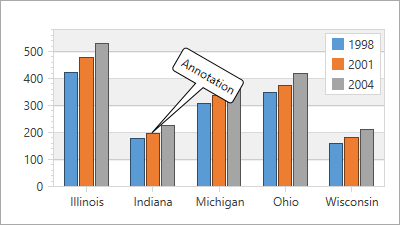 |
Appearance Customization
The Annotation.ContentTemplate property provides more flexible capabilities to configure the annotation data appearance. To do this, create a DataTemplate object defining how to display the annotation content and assign the template to the Annotation.ContentTemplate property.
The following XAML demonstrates how to customize annotation data:
<dxc:ChartControl.Annotations>
    <dxc:Annotation>
        <dxc:Annotation.Content>
            <local:AnnotationContent Text="Annotation"
                                ImageSource="{StaticResource imageSource}"/>
        </dxc:Annotation.Content>
        <dxc:Annotation.ContentTemplate>
            <DataTemplate>
                <StackPanel Orientation="Horizontal">
                    <Label
                           Margin="0,0,4,0"
                           Content="{Binding Text}"/>
                         <Image
                                Width="48"
                                Height="48">
                             <Image.Source>
                                <BitmapImage UriSource="{Binding ImageSource}"/>
                             </Image.Source>
                         </Image>
                </StackPanel>
            </DataTemplate>
         </dxc:Annotation.ContentTemplate>
         <dxc:Annotation.AnchorPoint>
                 <dxc:ChartAnchorPoint X="200"
                                       Y="100"/>
         </dxc:Annotation.AnchorPoint>
         <dxc:Annotation.ShapePosition>
                 <dxc:RelativePosition ConnectorLength="80"
                                       Angle="-30"/>
         </dxc:Annotation.ShapePosition>
    </dxc:Annotation>
</dxc:ChartControl.Annotations>
The following image demonstrates an annotation with the customized Annotation.ContentTemplate property.
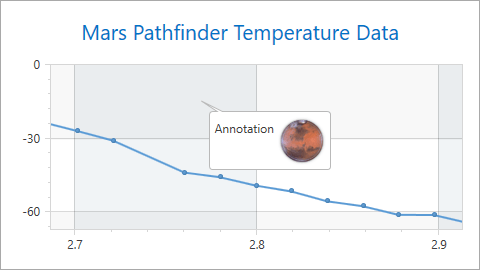
Also, you can use common appearance properties derived from the Control class to modify annotation appearance.